Project —Task Trees and Dependencies
Users new to ConceptDraw PROJECT will find the Basic lessons an essential platform for familiarizing themselves with the program′s functions. This video lesson will teach you how to set up task trees and dependencies."Task management is the process of managing tasks through its life cycle. It involves planning, testing, tracking and reporting. Task management can help either individuals achieve goals, or groups of individuals collaborate and share knowledge for the accomplishment of collective goals. Tasks are also differentiated by complexity, from low to high.
Effective task management requires managing all aspects of a task, including its status, priority, time, human and financial resources assignments, recurrency, notifications and so on. These can be lumped together broadly into the basic activities of task management. ...
Task management may form part of project management and process management and can serve as the foundation for efficient workflow in an organisation. Project managers adhering to task-oriented management have a detailed and up-to-date project schedule, and are usually good at directing team members and moving the project forward. ...
Task life cycle.
The status of tasks can be described by the following states:
Ready,
Assigned,
Terminated,
Expired,
Forwarded,
Finished,
Failed." [Task management. Wikipedia]
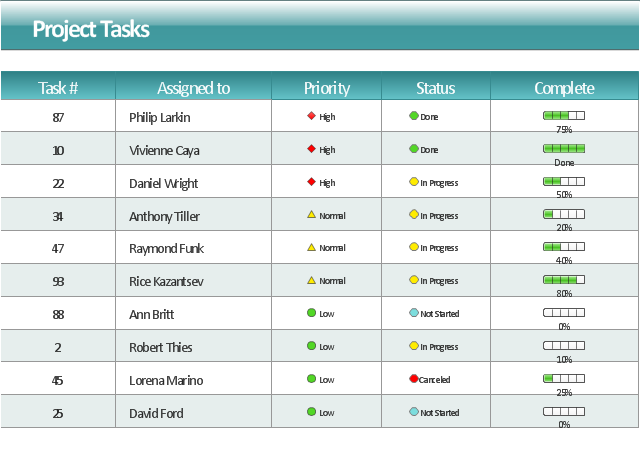
The example "Project management task status dashboard" was created using the ConceptDraw PRO diagramming and vector drawing software extended with the Status Dashboard solution from the area "What is a Dashboard" of ConceptDraw Solution Park.
Managing the task list
Four lessons explaining how to manage your task list in a Gantt chart. You will learn how to adjust your Gantt chart view, how to add/delete tasks or subtasks, how to change tasks hierarchy, how to show/hide subtasks.Gantt charts for planning and scheduling projects
ConceptDraw PROJECT is an excellent simple project scheduling software. It maintain classic project gantt charts and the line of professional reports on resources usage. It include handy critical path scheduling software tools and diagraming tools which helps prepare the presentation of project status. It include project tracking dashboard to keep project metrics upto date, also it have handy feature to export project management dashboard in excel file.Software development with ConceptDraw products
Internet solutions on ConceptDraw base. What may interest developers of Internet solutions.Business diagrams & Org Charts with ConceptDraw DIAGRAM
The business diagrams are in great demand, they describe the business processes, business tasks and activities which are executed to achieve specific organizational and business goals, increase productivity, reduce costs and errors. They let research and better understand the business processes. ConceptDraw DIAGRAM is a powerful professional cross-platform business graphics and business flowcharting tool which contains hundreds of built-in collections of task-specific vector stencils and templates. They will help you to visualize and structure information, create various Business flowcharts, maps and diagrams with minimal efforts, and add them to your documents and presentations to make them successful. Among them are Data flow diagrams, Organization charts, Business process workflow diagrams, Audit flowcharts, Cause and Effect diagrams, IDEF business process diagrams, Cross-functional flowcharts, PERT charts, Timeline diagrams, Calendars, Marketing diagrams, Pyramids, Target diagrams, Venn diagrams, Comparison charts, Analysis charts, Dashboards, and many more. Being a cross-platform application, ConceptDraw DIAGRAM is very secure, handy, free of bloatware and one of the best alternatives to Visio for Mac users.
- Status Dashboard | PM Dashboards | Project management task ...
- Project task status dashboard - Template | Project management task ...
- Project management task status dashboard
- Project task status dashboard - Conceptdraw.com
- PM Dashboards | Project Management Area | Project tasks dashboard
- Project management task status dashboard
- PM Dashboards | How To Create Project Report | What is a ...
- PM Dashboards | Status Dashboard | Project tasks dashboard |
- PM Planning | Status Dashboard | Project tasks dashboard |
- How To Create Project Report | Product Overview | Project tasks ...
- Status Dashboard | Project task status dashboard - Template | PM ...
- Project Task Trees and Dependencies | PM Easy | Diagramming ...
- Product Overview | Project tasks dashboard | Project Assigning ...
- How To Create Project Report | What is a Dashboard Area | |
- Status Dashboard | Projects HR dashboard | Project tasks dashboard |
- How To Hold Project Collaboration via Skype | One formula of ...
- How To Create Emergency Plans | Managing the task list | GUI ...
- What is Gantt Chart
- Project Task Trees and Dependencies | Decision Making ...
- Gantt Chart Software | How to Report Task's Execution with Gantt ...


