Project —Task Trees and Dependencies
Users new to ConceptDraw PROJECT will find the Basic lessons an essential platform for familiarizing themselves with the program′s functions. This video lesson will teach you how to set up task trees and dependencies.ConceptDraw Arrows10 Technology
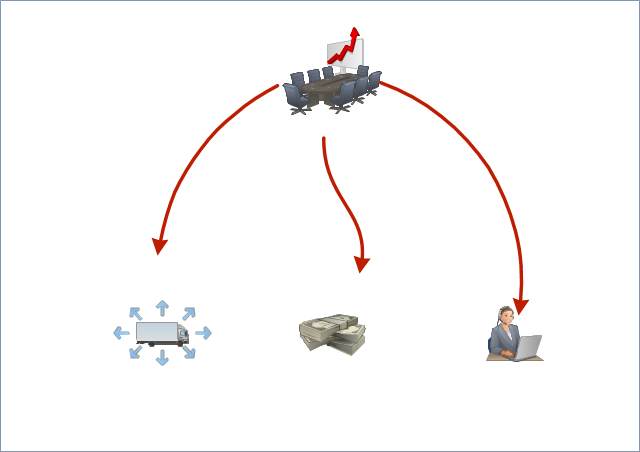
How should diagramming software work? The answer is - Fast and easy. "Tree"- mode drawing works like that. Just select objects in your drawing and press Tree or Chain button to connect all of them just in one click. Your diagram looks professional and it took only a moment to draw.
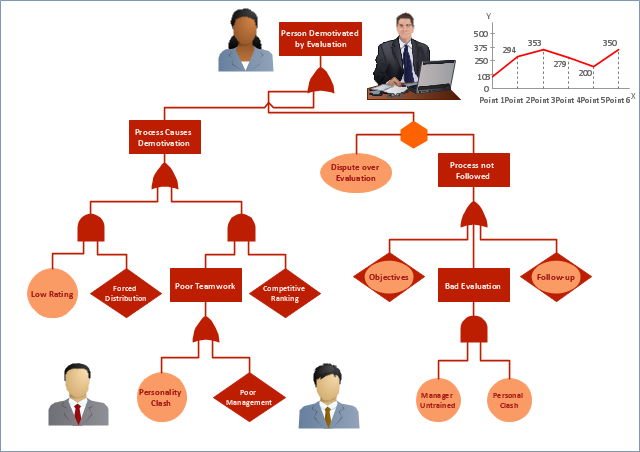
 Fault Tree Analysis Diagrams
This solution extends ConceptDraw PRO v9.5 or later with templates, fault tree analysis example, samples and a library of vector design elements for drawing FTA diagrams (or negative analytical trees), cause and effect diagrams and fault tree diagrams.
HelpDesk
How To Create Root Cause Analysis Diagram Using ConceptDraw Office
Root Cause Analysis (RCA) is used to determine the main causes of the problem. If the certain factor is the root cause, this mean that its vanishing will help to prevent the further recurrence of the problem. Root Cause Analysis diagram is used to analyze the root causes of factors that influence the problem. It helps to identify the root causes for a factor and then propose possible corrective actions. A diagram is constructed separately for each high priority factor. The ability to create a RCA tree diagram from a mind map is supported by the ConceptDraw Seven Management and Planning Tools solution.Fault tree analysis diagrams solution extends ConceptDraw PRO software with templates, samples and library of vector stencils for drawing the FTA diagrams.
Used Solutions
HelpDesk
How to Create a Fault Tree Analysis Diagram (FTD) in ConceptDraw PRO
Fault Tree Diagram are logic diagram that shows the state of an entire system in a relationship of the conditions of its elements. Fault Tree Diagram are used to analyze the probability of functional system failures and safety accidents. ConceptDraw PRO allows you to create professional Fault Tree Diagrams using the basic FTD symbols. An FTD visualize a model of the processes within a system that can lead to the unlikely event. A fault tree diagrams are created using standard logic symbols . The basic elements in a fault tree diagram are gates and events.
 Seven Management and Planning Tools
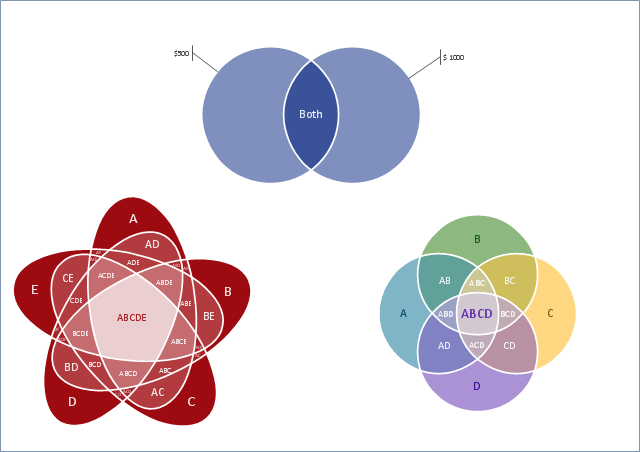
Seven Management and Planning Tools solution extends ConceptDraw PRO and ConceptDraw MINDMAP with features, templates, samples and libraries of vector stencils for drawing management mind maps and diagrams.
- How to Draw an Organization Chart | Fault Tree Analysis Diagrams ...
- Root cause analysis tree diagram - Template | Fault Tree Analysis ...
- Decision tree diagram | Influence Diagram Software | Decision ...
- Tree Chart Of Economic Planning
- Top 5 Android Flow Chart Apps | Fault Tree Analysis Diagrams ...
- CORRECTIVE ACTIONS PLANNING. PERT Chart | CORRECTIVE ...
- Nature | Water Animals Chart For Tree Diagram
- Planning Tree Chart
- | PROBLEM ANALYSIS. Root Cause Analysis Tree Diagram | How ...
- Tree Chart Maker App For Android
- How to Draw an Organization Chart | Organizational Structure ...
- Best Software For Tree Diagram
- How to Draw an Organization Chart | Process Flowchart ...
- Influence Diagram Software | Marketing Charts | Influence Diagram ...
- Top 5 Android Flow Chart Apps | Network Glossary Definition | Tree ...
- PROBLEM ANALYSIS. Root Cause Analysis Tree Diagram | Fault ...
- PROBLEM ANALYSIS. Root Cause Analysis Tree Diagram ...
- Fault Tree Analysis Diagrams | Cause and Effect Analysis | Fault ...
- Organizational Chart Template | Fault Tree Analysis Diagrams ...
- Risk diagram (PDPC) - Template | Process decision program chart ...


