HelpDesk
How to Create a Gantt Chart for Your Project
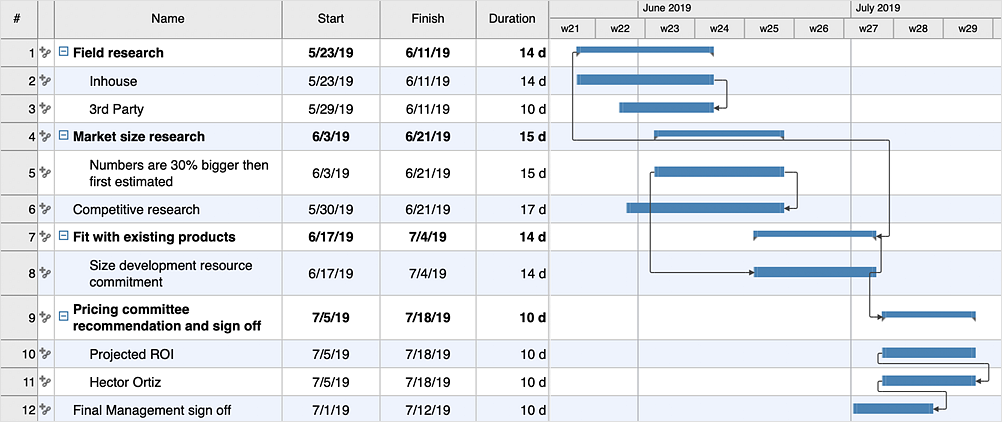
Instruction on how to create Gantt chart using ConceptDraw PROJECT software. Gant Chart is a graphical representation of tasks as segments on a time scale. It helps plan or overlapping.What is Gantt Chart (historical reference)
Historical reference about the Gantt chart.
 PM Easy
PM Easy solution extends the ConceptDraw PROJECT functionality with an ability to support neutral methodology of project management and to quickly start a project by listing the task relationships and dependencies, that makes the iterative planning much easier. The project management tool and available visual tools, such as mind mapping, increase the effectiveness of tracking and analysis your project tasks. PM Easy solution from ConceptDraw Solution Park is mainly targeted at project managers in small or medium-sized companies, allowing them to make the project plan and execute projects using mind mapping technique, to implement planning using mind mapping, and to track tasks using ConceptDraw PROJECT application.
HelpDesk
How to Support Your Mind Map with Visual Elements
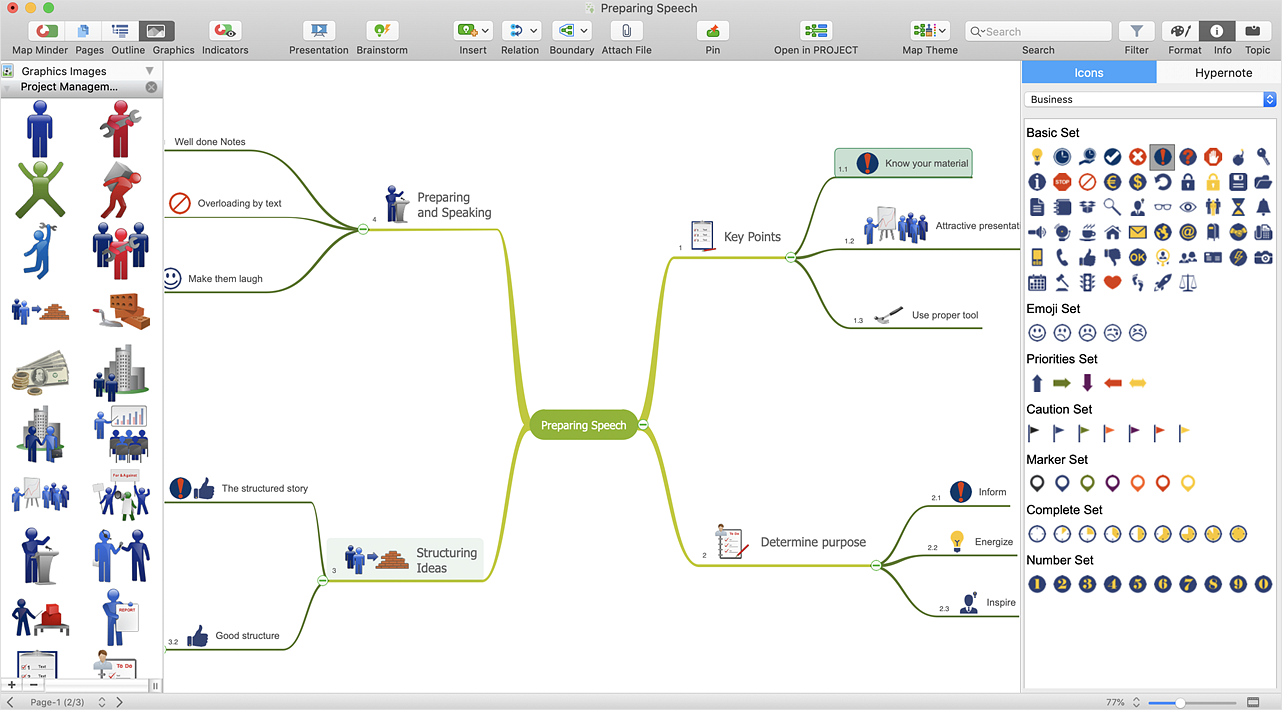
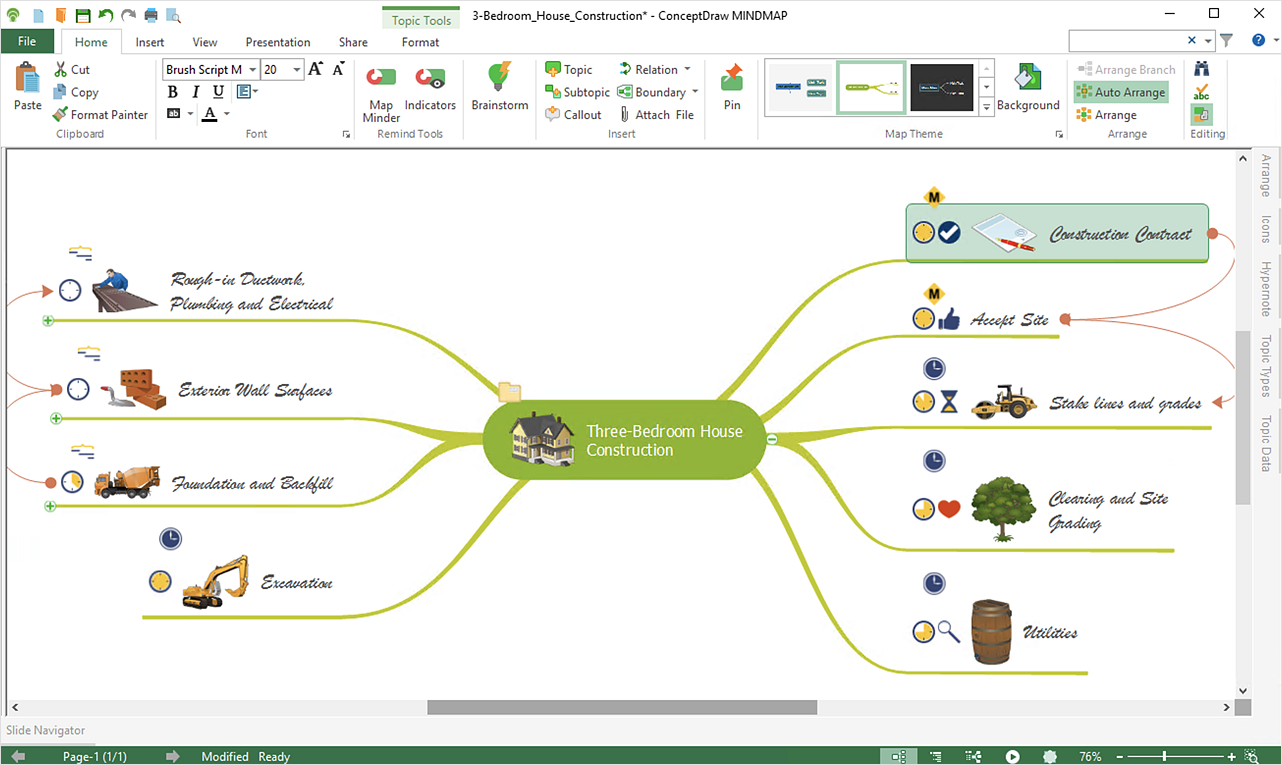
Symbols and images that you can add to ideas in your mind map help to extend the meaning and add context to topics. These visual elements can be used to depict priority, types of actions (phone calls, meetings, emails, etc), and kinds of information or ideas. You can easily incorporate images and symbols into your mind maps making them even more memorable and brain friendly.HelpDesk
How to Create Project Dashboard on Mac
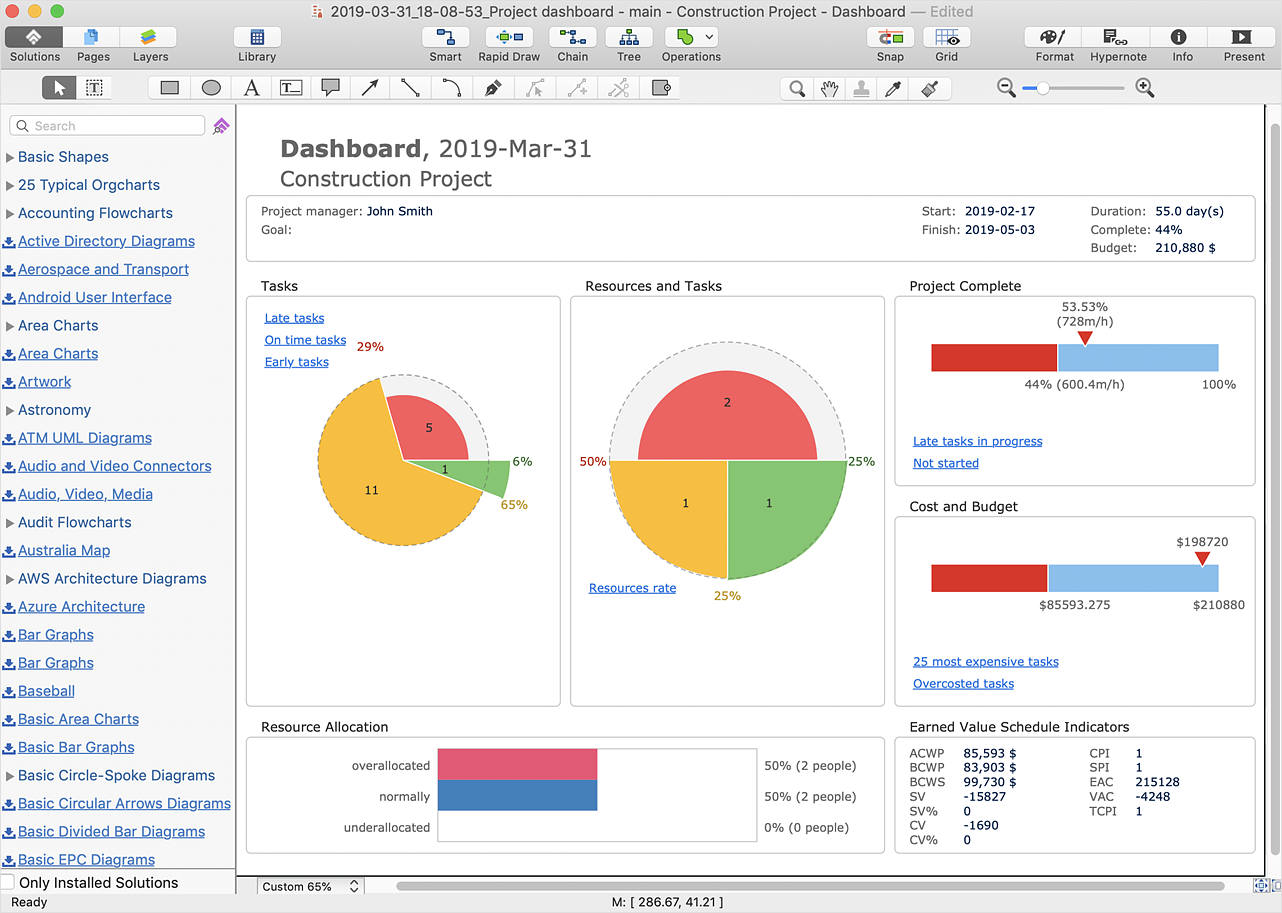
The visual Project Dashboard within ConceptDraw Office is the best way to deliver a clear view of project performance to all project participants.HelpDesk
How to Export Project Data to MS Excel Worksheet
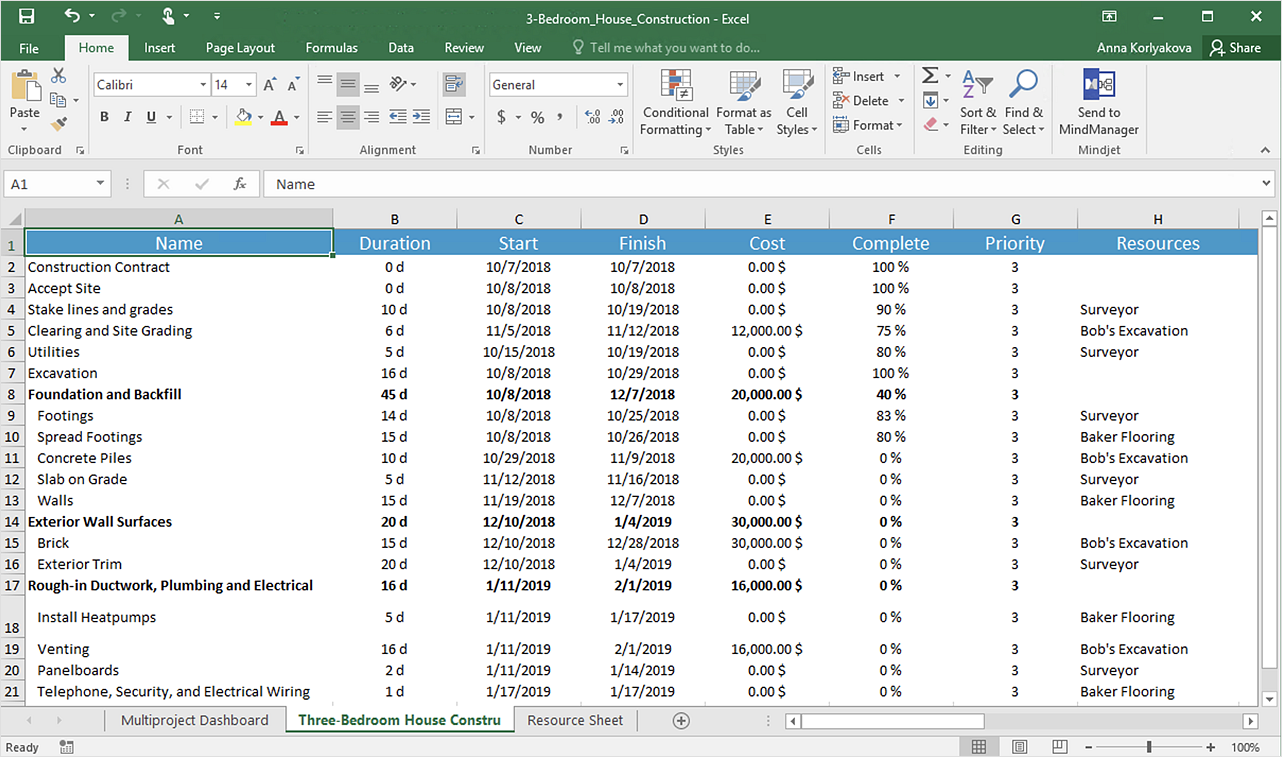
You can share your ConceptDraw PROJECT files with colleagues who use MS Excel®using the export capabilities of ConceptDraw PROJECT.ConceptDraw DIAGRAM Compatibility with MS Visio
The powerful diagramming and business graphics tools are now not exception, but the norm for today’s business, which develop in incredibly quick temp. But with the abundance of powerful business diagramming applications it is important to provide their compatibility for effective exchange the information between the colleagues and other people who maybe use different software in their work. During many years Microsoft Visio™ was standard file format for the business and now many people need the visual communication software tools that can read the Visio format files and also export to Visio format. The powerful diagramming and vector drawing software ConceptDraw DIAGRAM is ideal from the point of view of compatibility with MS Visio. Any ConceptDraw DIAGRAM user who have the colleagues that use MS Visio or any who migrates from Visio to ConceptDraw DIAGRAM , will not have any problems. The VSDX (Visio′s open XML file format) and VDX formatted files can be easily imported and exported by ConceptDraw DIAGRAM , you can see video about this possibility.HelpDesk
How to Change the Font for an Entire Level of a Mind Map
The visual representation of information is much more productive than simple linear transfer because it is more natural for our brain to understand information in the form of visual images. ConceptDraw MINDMAP will help you put your thoughts and ideas across to any audience in the most intelligible and memorable way. Mind maps can be used in a great number of situations involving analysis, learning, research, and thinking. Use them for personal planning, preparing lists, working on projects, as well as analyzing problems and finding solutions. ConceptDraw MINDMAP provides a variety of style and formatting options for your mind maps, that let you add more information to your mind map without interfering with its readability.Product Overview
ConceptDraw PROJECT is a vigorous tool for managing single or multiple projects. It lets you determine all essential elements involved into project, control schedules, resources and finances, and monitor projects' progress in most effective yet simple manner.HelpDesk
How to Create Project Diagrams on PC
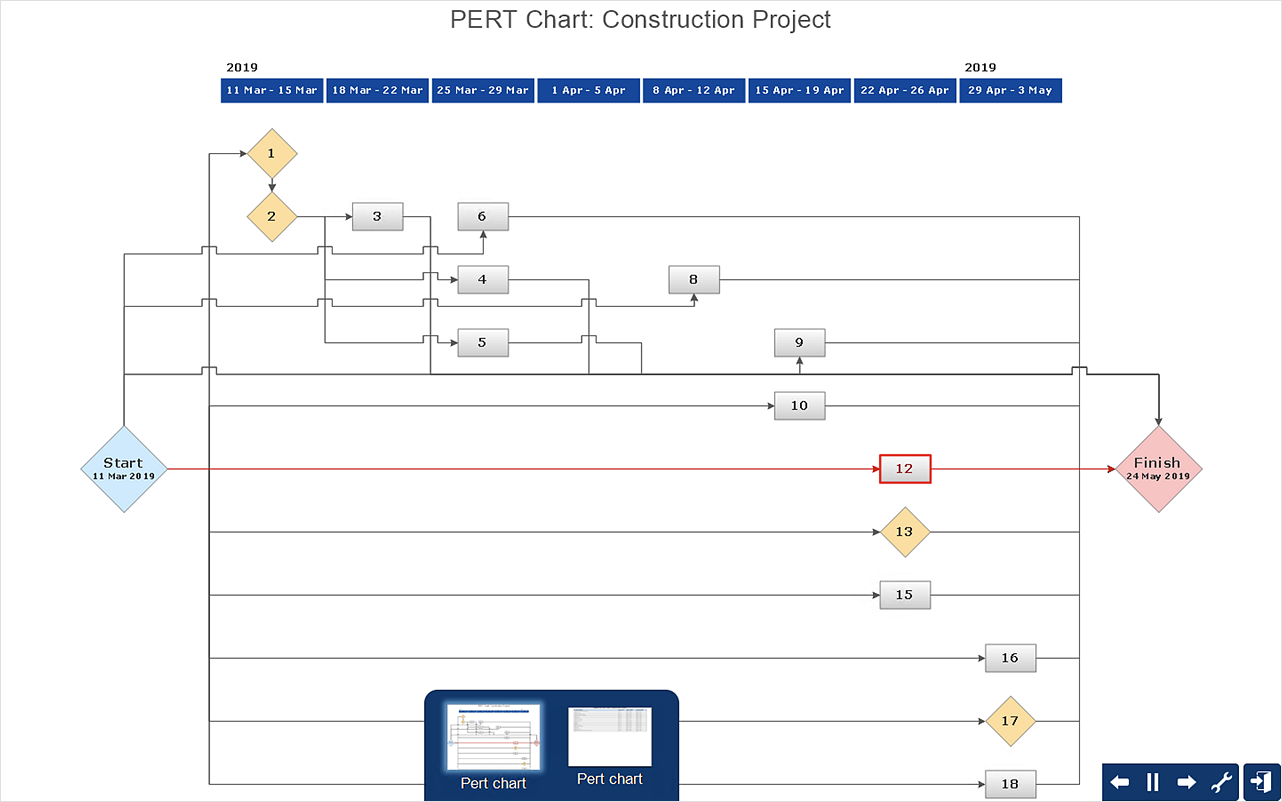
Visual diagrams gives the ability to view at a detailed level project attributes such as project scope, logical connections in the project, critical paths, key events on the timeline, milestones, tasks, calendars for work, and resource utilization.HelpDesk
How to Create a PowerPoint® Presentation from a Mind Map
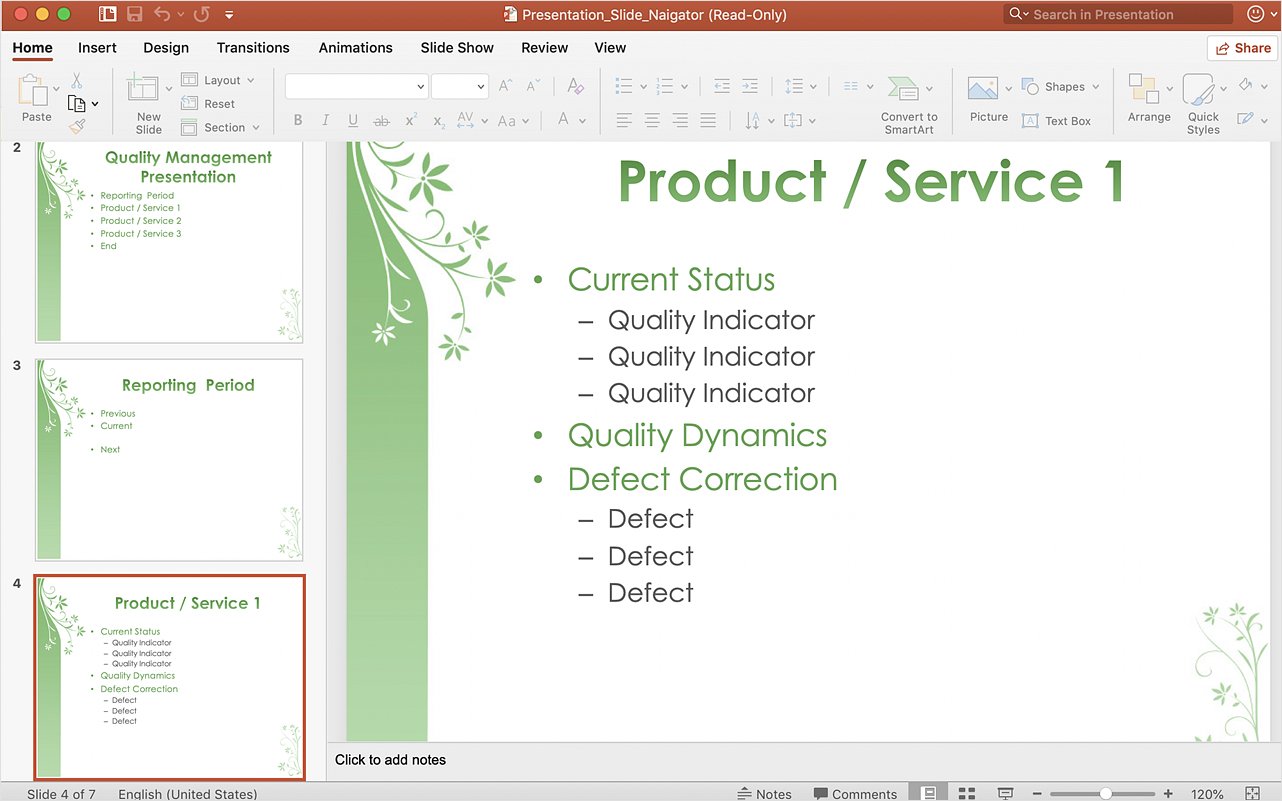
ConceptDraw MINDMAP allows you to create a traditional PowerPoint Presentation from your mind maps. There are two different variants when exporting to PowerPoint - one places editable text into the template of your choice, the other places the pieces of the map that you want to show into the slides.- How to Create Presentation of Your Project Gantt Chart | How To Do ...
- How to Create Gantt Chart | Create Response Charts | Activity ...
- How to Draw an Organization Chart | Pie Chart Examples and ...
- How to Create Gantt Chart | Activity Network (PERT) Chart | Activity ...
- How to Draw a Gantt Chart Using ConceptDraw PRO | How to ...
- Status Dashboard | PM Dashboards | Project tasks dashboard ...
- Construction Project Chart Examples | Gantt charts for planning and ...
- PM Dashboards | How to Manage Multiple Projects on Windows ...
- Visualization of databases with ConceptDraw PRO | Visual ...
- PROBLEM ANALYSIS Root Cause Analysis Tree Diagram | Visual ...
- Flowchart of Products. Flowchart Examples | Gantt chart examples ...
- PM Easy | Gantt Chart Software | Project — Working With Costs ...
- How to Make a Mind Map from a Project Gantt Chart | Pyramid Chart ...
- Gantt chart examples | Software development with ConceptDraw ...
- Visual Presentations Made Easy with Diagramming Software | How ...
- Percentage Pie Chart . Pie Chart Examples
- How to Draw an Organization Chart | Process Flowchart | Create ...
- Gantt chart examples | What Constitutes a Project? | Gant Chart in ...
- Status Dashboard | Project task status dashboard - Template | PM ...
- Project — Working With Costs | How to Create Presentation of Your ...
