Map Software
Create maps, flags, and more with ConceptDraw
 Nature
This solution extends ConceptDraw PRO software with samples, templates and libraries of vector clipart for drawing the Nature illustrations. Use it to make professional-looking documents, presentations and websites illustrated with color scalable vector c
 Maps
Maps
This solution extends ConceptDraw PRO v9.4 with the specific tools necessary to help you draw continental, directional, road, or transit maps, to represent international, business, or professional information visually.
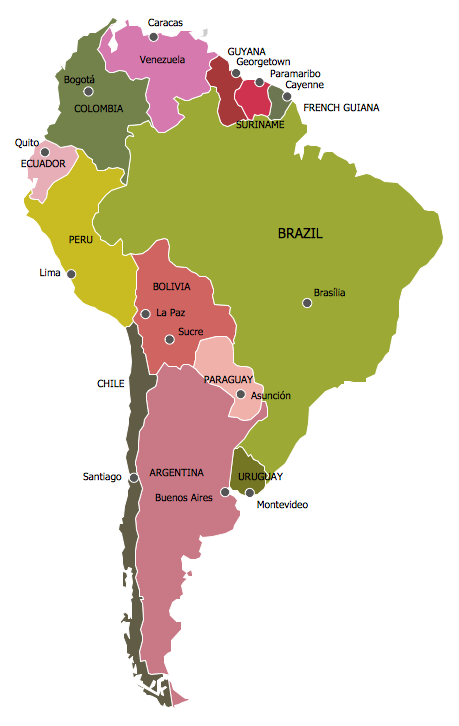
Map of Continents
A continent is one of several very large landmasses on Earth. ConceptDraw PRO diagramming and vector drawing software offers the unique Continent Maps Solution from the Maps Area which is indispensable for drawing the map of continents of the Earth.Geo Map - Asia - Philippines
The Philippines, officially known as the Republic of the Philippines, is a sovereign island country in Southeast Asia situated in the western Pacific Ocean.Use the Continent Maps solution and Philippines library to draw thematic maps, geospatial infographics and vector illustrations. This solution to help visualize the business and thematic information connected with geographic areas, locations or customs; for your business documents, presentations and websites.
 Sales Dashboard
Sales Dashboard solution extends ConceptDraw PRO software with templates, samples and library of vector stencils for drawing the visual dashboards of sale metrics and key performance indicators (KPI).
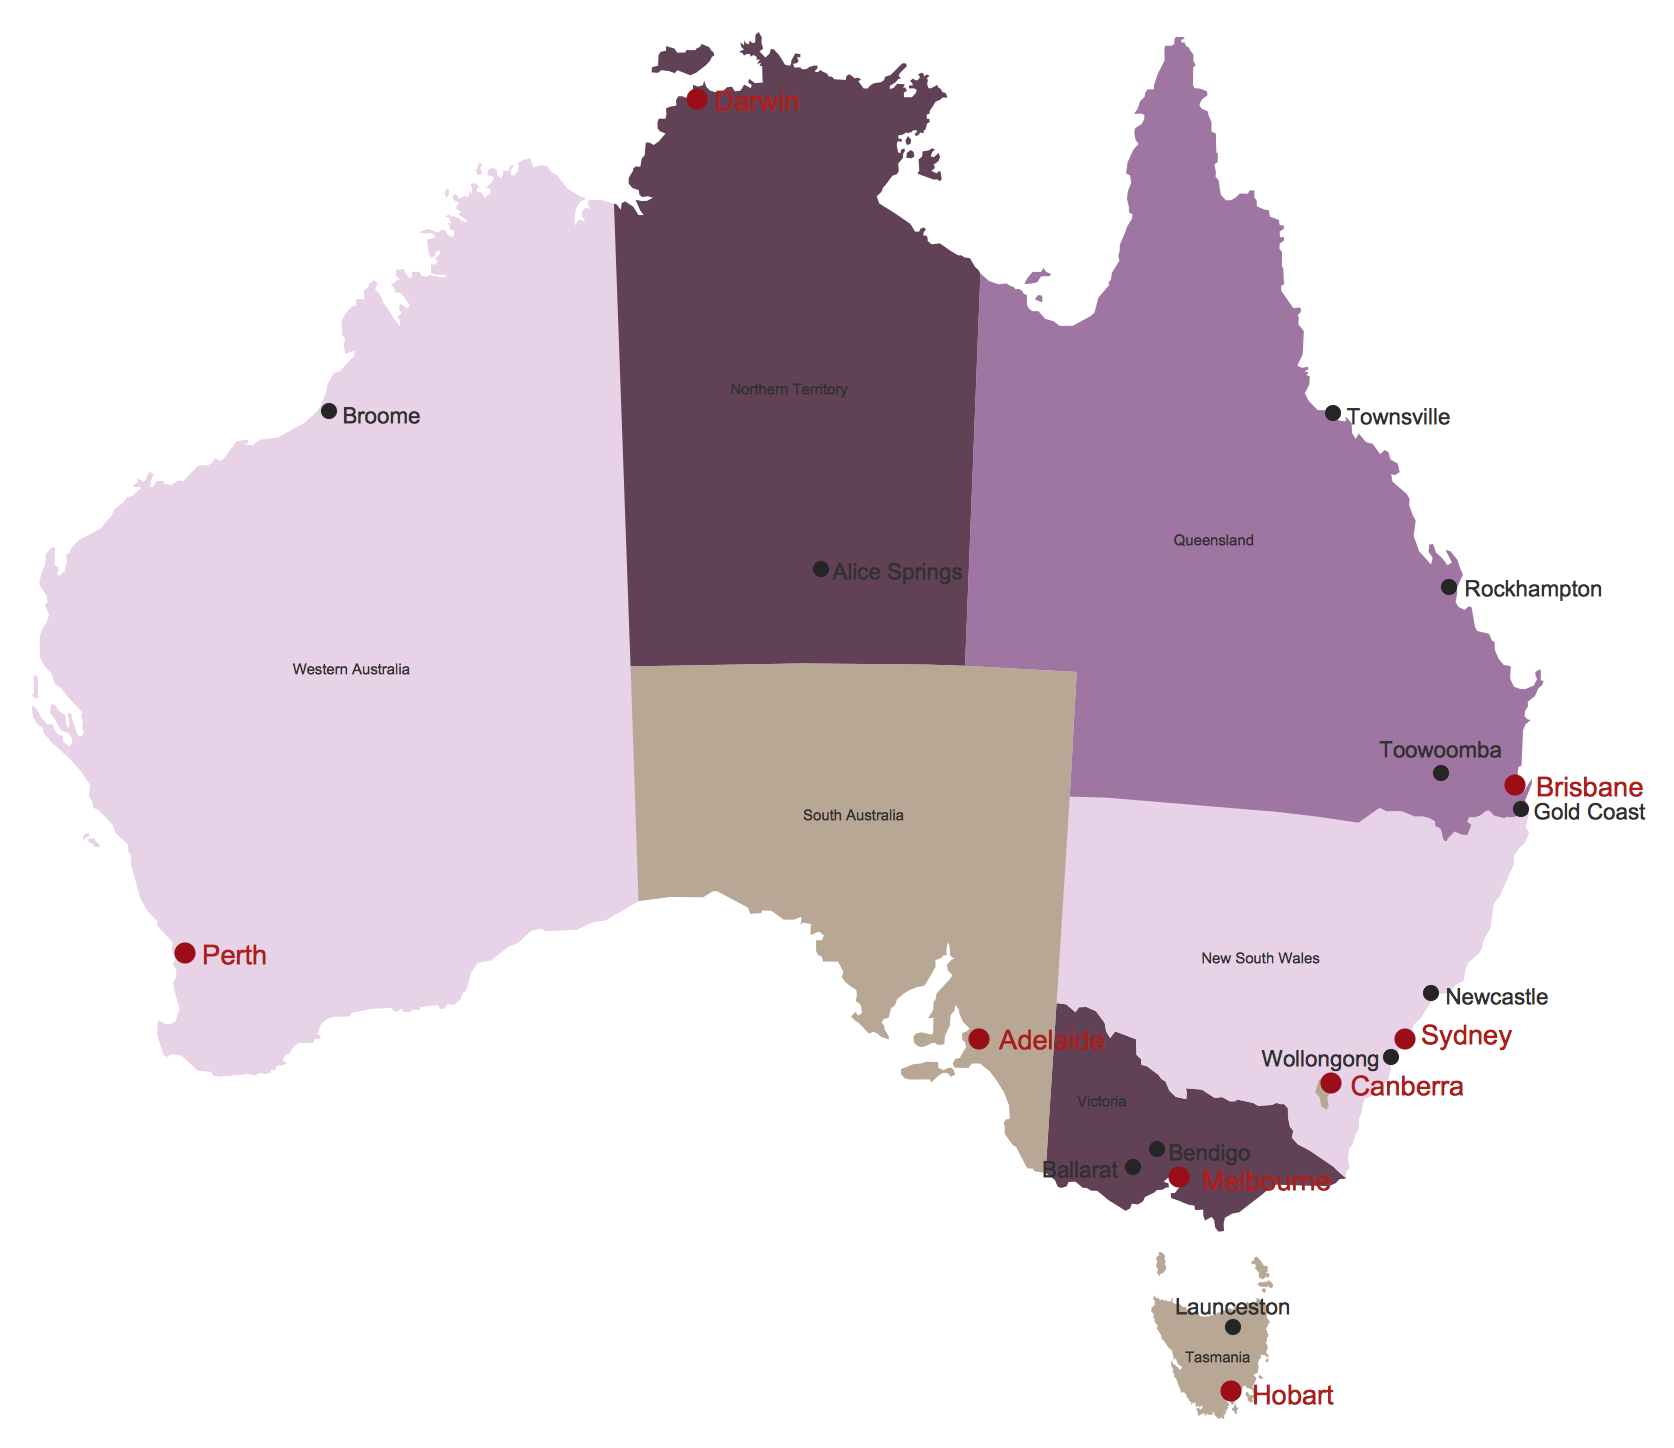
Australia Map
Maps surround us everywhere in our life, study, work, traveling, they are widely used in geography, history, politics, economics, and many other fields of science and life activity. But designing of maps is usually complex and labor-intensive process. Now we have the possibility to make easier this process - ConceptDraw PRO diagramming and vector drawing software extended with Australia Map Solution from the Maps Area of ConceptDraw Solution Park will help us in easy drawing detailed Australia map.Map of USA
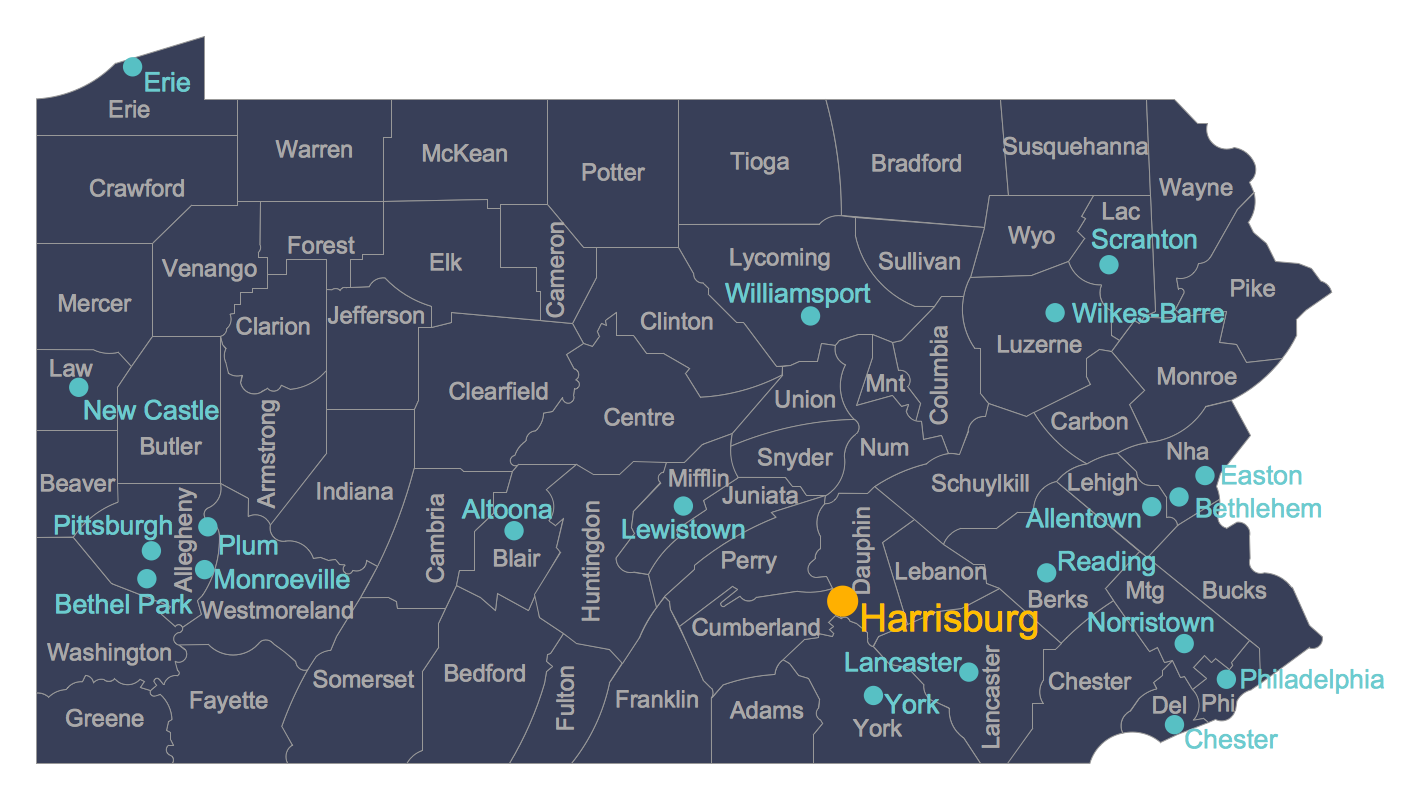
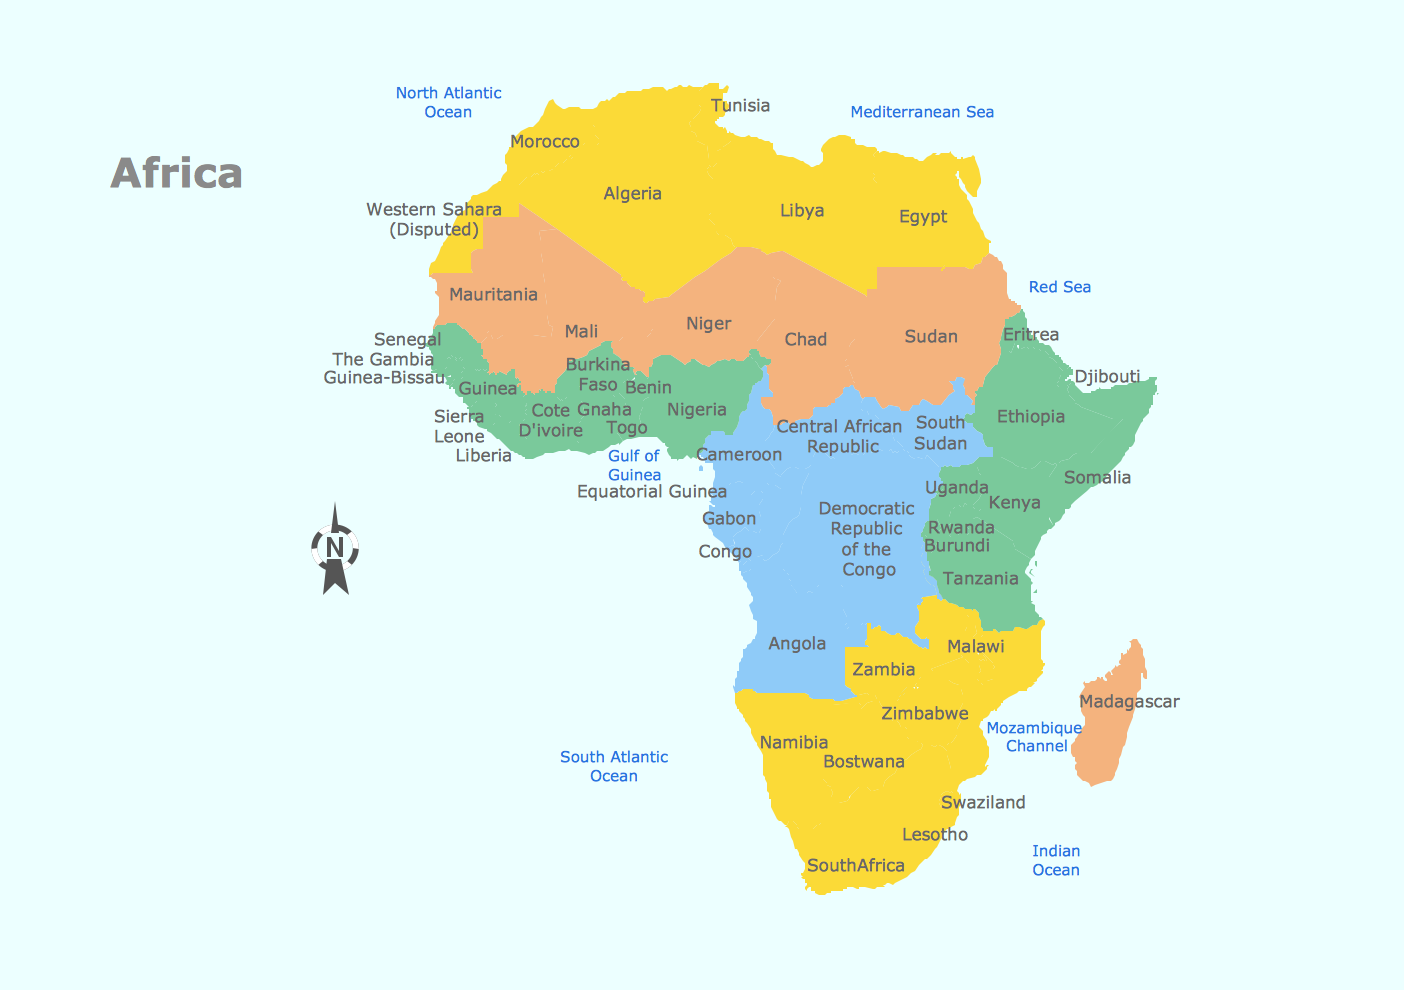
It is impossible to imagine modern life and science without maps, they surround us anywhere, they are used in geography, history, politics, economics, and many other fields of science. ConceptDraw PRO diagramming and vector drawing software offers the USA Maps Solution from the Maps Area of ConceptDraw Solution Park with its collection of samples and libraries for easy drawing the Map of USA.Geo Map - Africa
Africa has 54 fully recognized sovereign states, 9 territories and two de facto independent states with limited or no recognition.Vector design elements library Africa contains country map contours, geographical maps, cartograms and thematic maps for ConceptDraw PRO diagramming and vector drawing software. To help visualize the business and thematic information connected with geographic areas, locations or customs.
All ConceptDraw PRO documents are vector graphic files and are available for reviewing, modifying, and converting to a variety of formats: image, HTML, PDF file, MS PowerPoint Presentation, Adobe Flash, MS Visio (.VDX, .VSDX).
How can you illustrate the weather condition
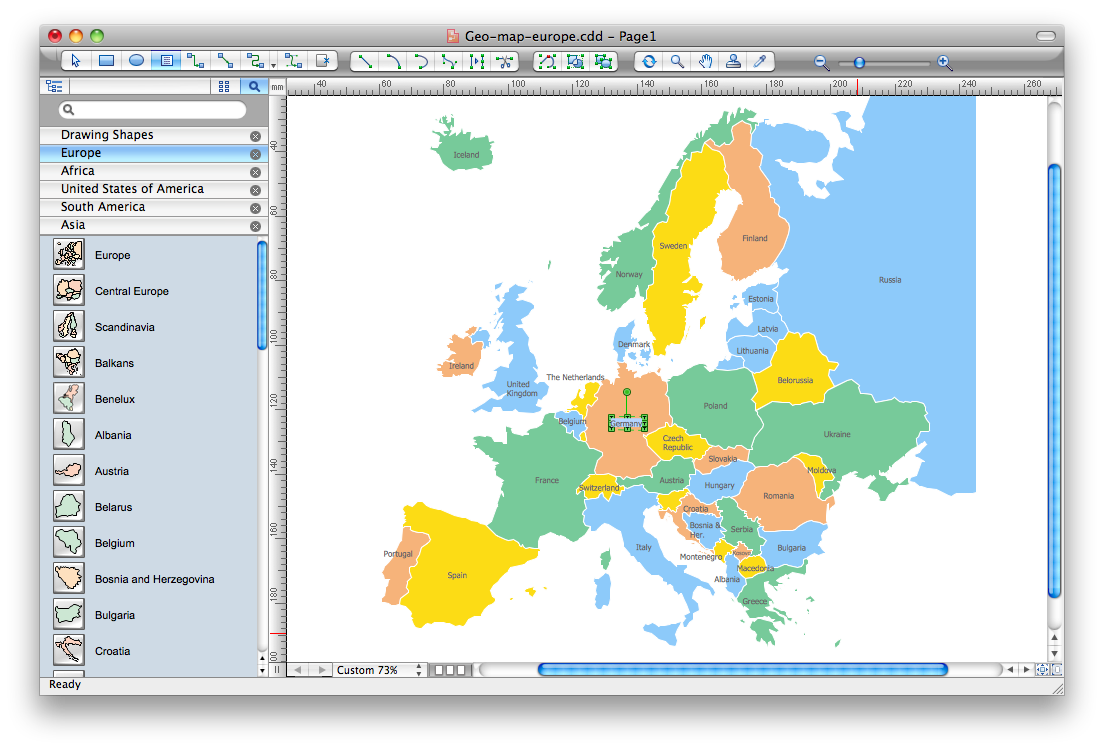
Use it to make professional looking documents, presentations, and websites illustrated with color scalable vector clipart for geography, weather, and animals.Geo Map - Europe - Bosnia and Herzegovina
The vector stencils library Bosnia and Herzegovina contains contours for ConceptDraw PRO diagramming and vector drawing software. This library is contained in the Continent Maps solution from Maps area of ConceptDraw Solution Park.Geo Map - USA - Arkansas
Arkansas is a state located in the Southern region of the United States.The vector stencils library Arkansas contains contours for ConceptDraw PRO diagramming and vector drawing software. This library is contained in the Continent Maps solution from Maps area of ConceptDraw Solution Park.
Geo Map - Africa - Rwanda
Rwanda, officially the Republic of Rwanda, is a sovereign state in central and east Africa.The vector stencils library Rwanda contains contours for ConceptDraw PRO diagramming and vector drawing software. This library is contained in the Continent Maps solution from Maps area of ConceptDraw Solution Park.
Geo Map - USA - Virginia
Virginia, officially the Commonwealth of Virginia, is a U.S. state located in the South Atlantic region of the United States.The vector stencils library Virginia contains contours for ConceptDraw PRO diagramming and vector drawing software. This library is contained in the Continent Maps solution from Maps area of ConceptDraw Solution Park.
 Illustration
This solution extends ConceptDraw PRO v9.4, allowing you to make professional-looking documents, presentations and websites illustrated with color, scalable vector clip art and shapes, regardless of drawing skills.
- What Is Flow Chart In Geography
- Nature | Maps | Map Software | Flow Charts In Geography
- Divided Bar Graph Geography
- Divided Bar Diagrams | Examples of Flowcharts , Org Charts and ...
- How To Draw Flow Diagram In Geography
- How To Draw A Divided Rectangle In Geography
- Flow Diagram Map In Geography
- An Example Of Flowchat In Geography
- How To Draw Divided Rectangle In Geography
- Solution Geography Diagram
- Basic Flowchart Symbols and Meaning | How to Create Flowchart ...
- How To Draw Divided Rectangle Of 10th Geography
- Geo Map - Europe - Iceland | Geography - Vector stencils library ...
- How to Draw a Natural Landscape | Drawing a Nature Scene ...
- Process Flowchart
- Bio Flowchart Lite | Artwork | Clipart School | Animals Pictures
- Design elements - Geography | Watercraft - Design Elements ...
- How To Draw A Easy Geography Picture
- Geography - Vector stencils library | Mathematics | Picture Graphs ...
- Geography - Vector stencils library | How to Draw a Natural ...
