How to Draw an Organization Chart
Running your own businesses? Managing people working in the company? Working as HR specialist? Then you definitely need the right software to work in, creating the charts, diagrams in terms of succeeding in your sphere. We know such software called ConceptDraw DIAGRAM which allows you in short terms to make organizational charts in order to share responsibilities and delegate authority. If you wonder what to start with and how to draw it, you can watch video on our site describing this process in details. Also you can download our application ConceptDraw STORE where lots of libraries with objects, vector elements and symbols are waiting for you to use them for your flowcharts as well as schemes, diagrams, charts and plans. To make sure you can do it in short terms, we provide you with examples and templates of pre-designed already existing charts to use them as the drafts for you so it can be always corrected and edited the way you want. The innovative ConceptDraw Arrows 10 Technology is the powerful drawing tool that can be used for making any kind of existing diagrams. Once you try, you’ll realize how simple and clever it is, so you will recommend ConceprDraw DIAGRAM to those who you do care about and so they will succeed as well.
 Pie Charts Solution. ConceptDraw.com
The Pie Chart is one of the most popular statistical charts , widely used to
visualize all kinds of data, in cases when you need to show the ratio of the part
and
HelpDesk
Creating a Pie chart. ConceptDraw HelpDesk
Pie charts are a visual data display method which could be given in a small table. Pie charts are useful for showing data that are classified in the nominal or
 Logistics Flow Charts . ConceptDraw.com
Logistics Flow Charts solution extends ConceptDraw DIAGRAM functionality with
opportunities of powerful logistics management software. It provides large
 Organizational Charts Solution. ConceptDraw.com
Organizational Charts solution extends ConceptDraw DIAGRAM software with
samples, templates and library of vector stencils for drawing the org charts .
HelpDesk
Drawing a Pictorial Charts. ConceptDraw HelpDesk
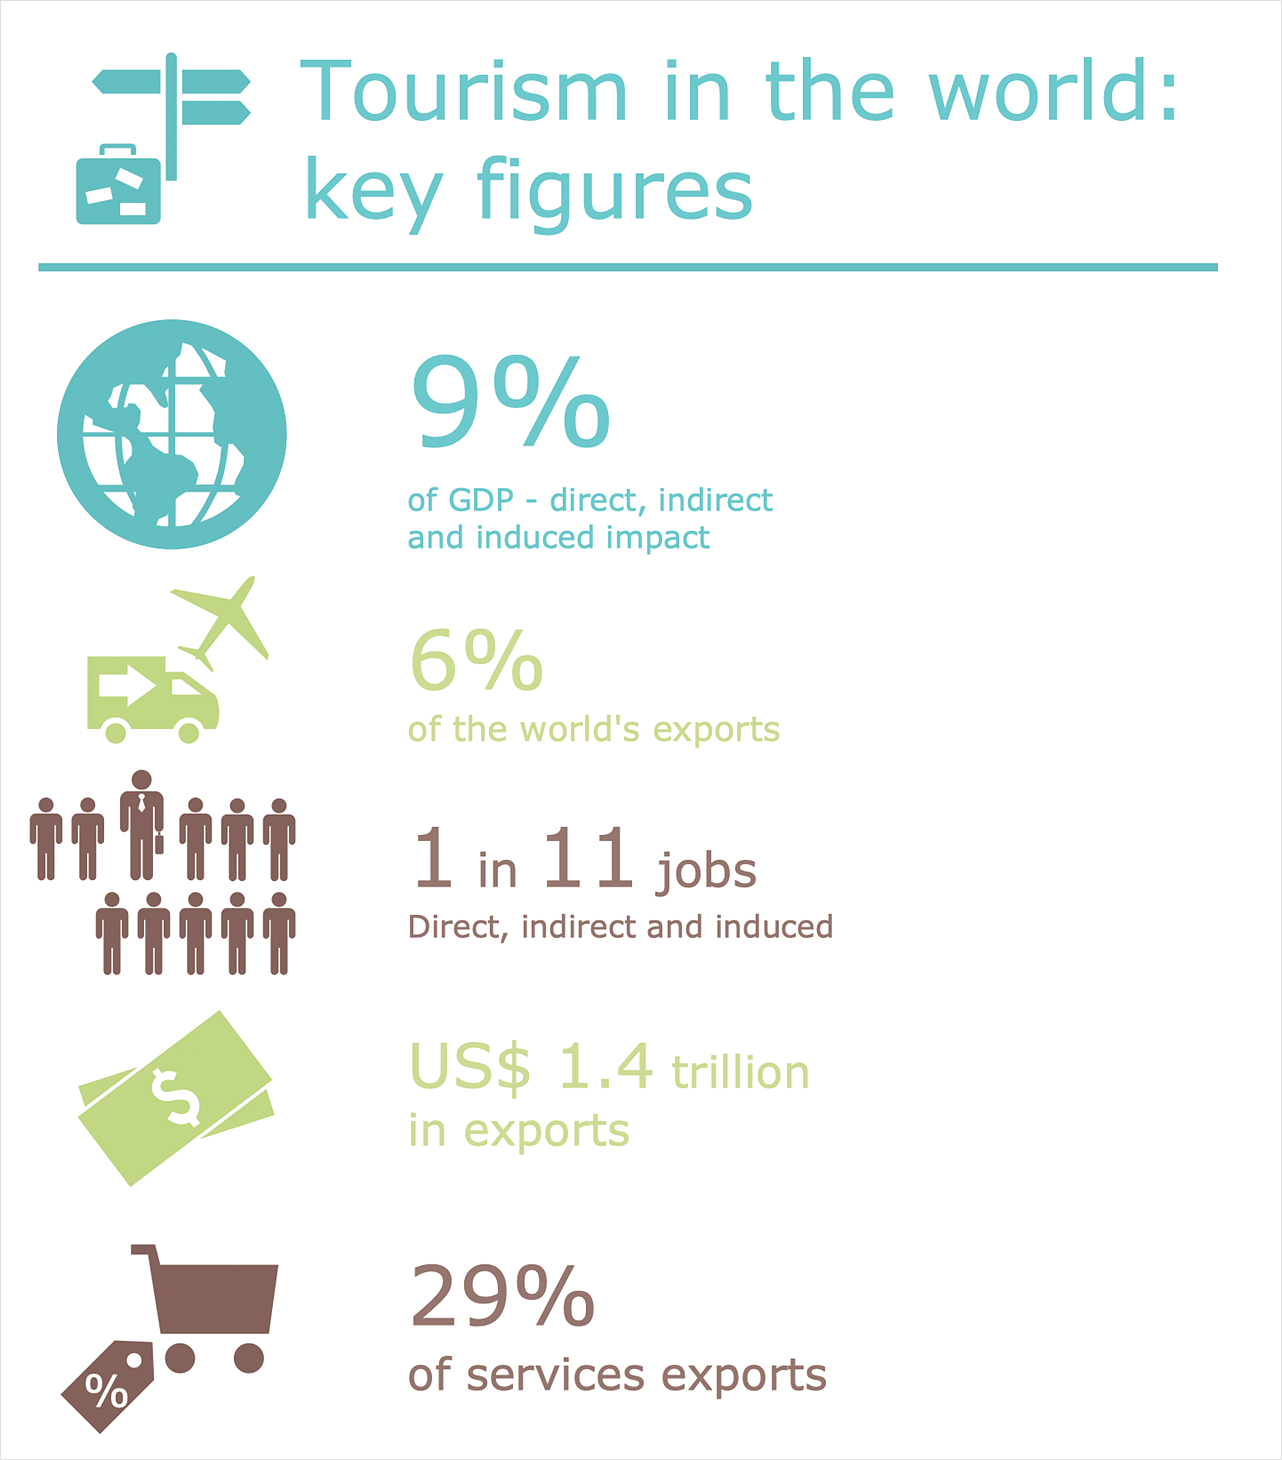
A Pictorial chart is a type of Pictorial Infographics. It is used to visually present data comparison. Pictorial charts use relative sizes or repetitions of the same icon ,Examples of Flowcharts, Organizational Charts , Network Diagrams
Drawing your own flowcharts, diagrams and plans it is better to use the existing layouts to be able to make them correctly with help of tutorials. Using examples from our site you can simplify your work making it possible to create business or network diagrams and any needed spectacular flowcharts with an easiness having all of them looking professional and mature. Try the Business Diagram, Floor Plan, Business Charts examples, Graphic Organizer ones, Scientific Illustration, Engineering Diagram ones, Illustration examples as well as very many more from our Solution Park and find it simple to create something special in short terms with almost no effort at all! Geo Map and Mind Map Examples, UML and Circular Diagram ones, Project Management Examples, Network and Business Diagram ones as well as lots and lots of charts, flowcharts, plans and diagrams are there to your service. ConceptDraw DIAGRAM is here for your use!
 Basic Pie Charts Solution. ConceptDraw.com
This solution extends the capabilities of ConceptDraw DIAGRAM with templates,
samples, and a library of vector stencils for drawing pie and donut charts .
HelpDesk
Drawing a Bar Chart . ConceptDraw HelpDesk
Bar charts (bar graphs) are diagrams displaying data as horizontal or vertical bars of certain heights. Bar charts are widely used to show and compare the valuesMarketing and Sales Organization chart
Working in marketing if it is internet one or for some supermarket making people shopping with pleasure enjoying their final choice, it is always important to have the professional tools for succeeding in what you do and one of these tools can be the professional software for marketers such as ConceptDraw DIAGRAM which can be used for creating the diagrams and flowcharts as well as organization charts and describing the desired sales process in a way of marketing plan. Having our software which contains so many templates and samples for making any kind of scheme, diagram and plan means having the right thing to simplify your work and your life making anything you need in a short terms and having the result of it looking very professional. Moreover, after finishing making what was planned to be made, you can always save, convert or review your document in any of these formats: image, PDF file, HTML, MS Visio, MS PowerPoint Presentation or Adobe Flash.- Percentage Pie Chart . Pie Chart Examples | Atmosphere air ...
- Atmosphere air composition | Percentage Pie Chart . Pie Chart ...
- Business Report Pie. Pie Chart Examples | Example of ...
- How to Draw the Different Types of Pie Charts | Visio Charting ...
- Schedule pie chart - Daily action plan | Chart Maker for ...
- Proximity Chart In Architecture
- Chart Examples | Pie Chart Examples and Templates | Business ...
- Schedule pie chart - Daily action plan | Chart Examples | Bar Graphs ...
- How to Draw an Organization Chart | Marketing and Sales ...
- Project Charts And Layouts Ppt
- What is Gantt Chart (historical reference) | Gantt charts for planning ...
- New Basic Pie Charts Solution for ConceptDraw PRO
- Logistics Flow Charts | Process Flowchart | How to Make a Logistics ...
- Schedule pie chart - Daily action plan | How to Draw a Pie Chart ...
- What Is Man Type Flow Process Chart
- CS Odessa Announces Additions to Powerful Graphs and Charts ...
- How to Draw the Different Types of Pie Charts | Pie Chart Examples ...
- Visio Donut Chart
- Basic Flowchart Symbols and Meaning | Flow Chart Symbols ...
- Organizational Structure | Create Organizational Chart | How to ...


