 Fishbone Diagrams Solution. ConceptDraw.com
The Fishbone Diagrams solution extends ConceptDraw PRO v10 software with
the ability to easily draw the Fishbone Diagrams (Ishikawa Diagrams) to clearly
 Fishbone Diagram Solution. ConceptDraw.com
This solution extends ConceptDraw PRO v9.4 software with the ability to easily
draw Fishbone Diagrams that can be used for cause and effect analysis.
Wikipedia] This 8Ms Ishikawa diagram (manufacturing cause and effect diagram)
template is included in the Fishbone Diagram solution from the Management
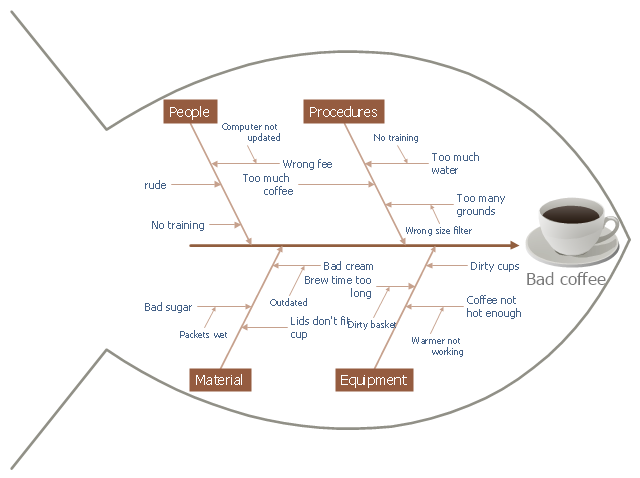
This cause and effect diagram sample was redesigned from the Wikimedia
Commons file: Fishbone BadCoffeeExample.jpg.
HelpDesk
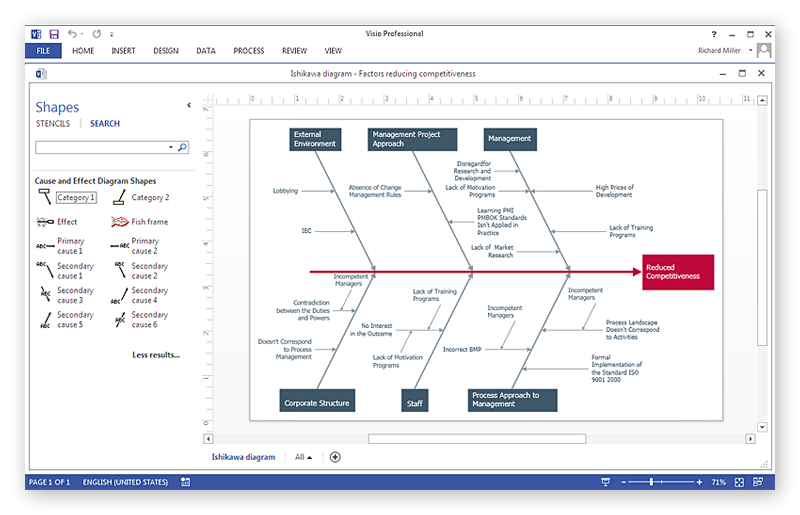
Create Visio Fishbone Diagram. ConceptDraw HelpDesk
ConceptDraw PRO allows you to easily create Fishbone (Ishikawa) diagram and then make a MS Visio VSDX, or VSD files from your diagrams in a couple clicksHelpDesk
The simplest way to create a Fishbone (Ishikawa) diagram
A Fishbone (Ishikawa) diagram is also called cause-and-effect diagram. Fishbone diagram is often used in business to determine the cause of some problem.- Fishbone diagram - Causes of low-quality output | Fishbone ...
- Fishbone Diagram Problem Solving | Using Fishbone Diagrams for ...
- Cause and Effect Diagram | How Do Fishbone Diagrams Solve ...
- Fishbone Diagrams | How Do Fishbone Diagrams Solve ...
- How Do Fishbone Diagrams Solve Manufacturing Problems ...
- Cause and Effect Analysis - Fishbone Diagrams for Problem Solving ...
- Fishbone Diagram | Fishbone Diagrams | Entity Relationship ...
- Fishbone Diagram Problem Solving | Human Resource ...
- Fishbone Diagrams | Fishbone Diagram Example | Fishbone ...
- Service 8 Ps fishbone diagram - Template | Fishbone Diagram ...
- Fishbone Diagram | How to Construct a Fishbone Diagram ...
- Fishbone Diagram | Fishbone Diagram Example | Fishbone ...
- Fishbone Diagrams | Competitor Analysis | Fishbone Diagram ...
- When To Use a Fishbone Diagram | Fishbone Diagram Design ...
- Manufacturing 8 Ms fishbone diagram - Template | How Do ...
- Fishbone Diagram Template | Fishbone Diagram | Fishbone ...
- Problem solving | Fishbone Diagram Problem Solving | PROBLEM ...
- Cause and Effect Analysis | Cause and Effect Analysis - Fishbone ...
- When To Use a Fishbone Diagram | Fishbone Diagram Problem ...
- Business and Finance | Fishbone Diagram | Fishbone Diagrams ...


