Process Flowchart Symbols: Meaning, Types and Examples
Process flowchart symbols are standardized diagram shapes used to represent steps, decisions, inputs, outputs, and connections in a process workflow.
This page provides a reference overview of common process flowchart symbols and their meaning in workflow and operational diagrams. These symbols are widely used in business process documentation, workflow charts, and procedure mapping. For a complete overview, see our flowchart guide.
Also called: process flow chart symbols, process flow diagram symbols, or standard process symbols used in workflow diagrams.
Quick reference: The most common process flowchart symbols are Terminator (Start/End), Process, Decision, Input/Output, Connector, Document, Data Storage, and Predefined Process.
Common process flowchart symbols include:
- Start / End (Terminator)
- Process
- Decision
- Input / Output
- Connector
- Document
- Data Storage
- Predefined Process
Last updated: 2026
On this page: definition, symbol meanings, reference tables, real process diagram examples, and practical guidance for using process flowchart symbols in workflow documentation.
What Are Process Flowchart Symbols?
Process flowchart symbols are standardized visual elements used to build structured process diagrams. Each process flowchart symbol has a specific meaning, which helps teams describe workflow steps, decisions, and process connections in a consistent way.
They are commonly used in business process diagrams, operational workflows, approval flows, system procedures, and other repeatable process maps. While general flowchart symbols can support many kinds of diagrams, process flowchart symbols are especially useful when the goal is to document how work moves through a business or operational sequence.
The sections below explain the meaning and typical use of each standard process flowchart symbol.
Where Process Flowchart Symbols Are Used
Process flowchart symbols are most often used in business process diagrams, workflow charts, operating procedures, approval sequences, and system-related process documentation.
This process-focused context is what separates process flowchart symbols from more general flowchart notation. In practice, these symbols are used when teams need to document repeatable work, define handoffs, and improve process clarity.
In practice: use process flowchart symbols to document operational steps, approvals, handoffs, and repeatable business workflows rather than general logic or abstract sequencing.
Standard Symbols and Process-Specific Use
Most process flow diagrams are built from a small set of standard flowchart symbols such as terminators, task steps, decisions, and input/output shapes. The difference is not only in the symbols themselves, but in how they are used to document real business workflows and operational handoffs.
In other words, process flowchart symbols usually rely on standard notation, but they are applied in a more process-focused context than general-purpose flowcharts.
Standard Process Flowchart Symbols
The most common process flowchart symbols form a practical visual language for process mapping. In most process flow diagrams, a small set of standard process flowchart symbols is enough to describe the sequence, control points, and outputs of a process.
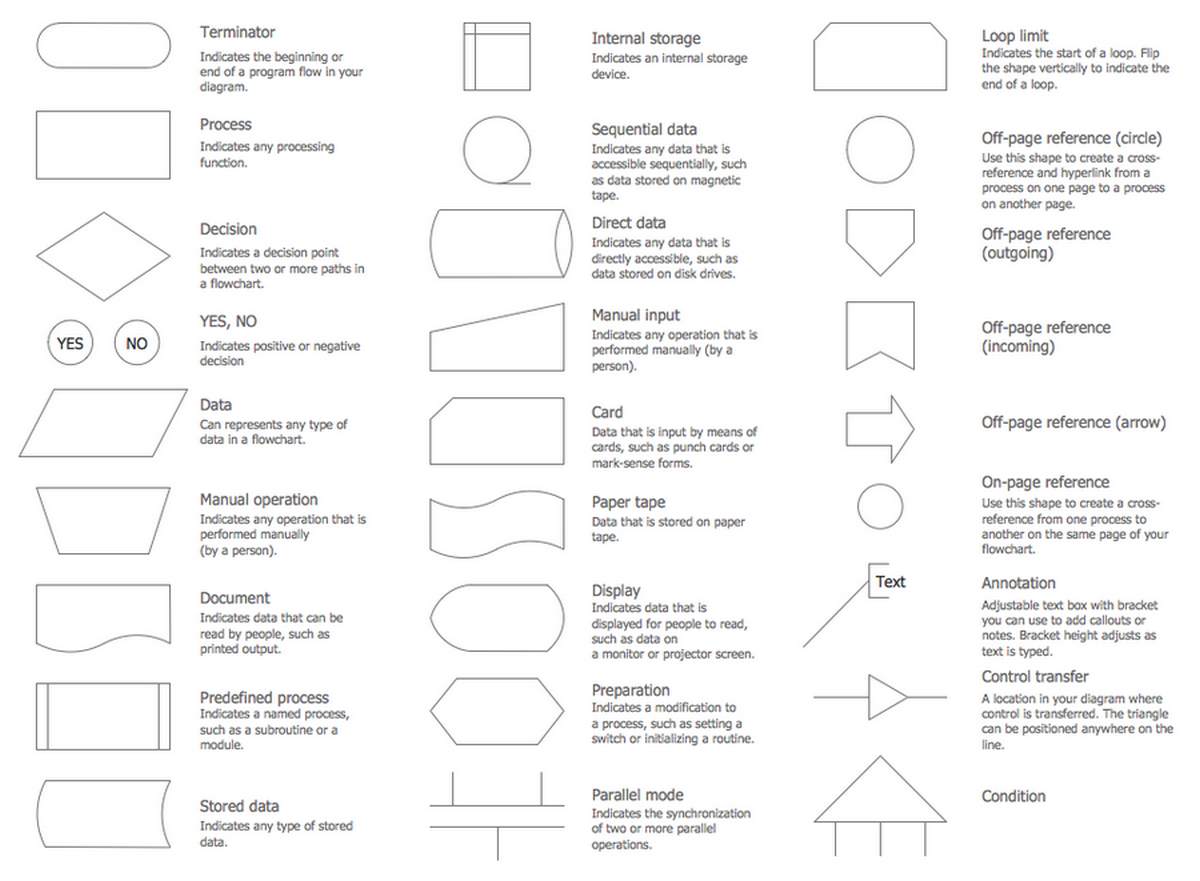
View full-size process flowchart symbols chart
This reference chart shows many of the standard flowchart symbols used to build process flow diagrams and workflow charts. Common shapes include the terminator, process step, decision, input/output, document, and predefined process.
This visual reference helps connect symbol names with their role inside real process flow diagrams before moving into the detailed symbol descriptions below.
Once the symbol set is clear, it becomes easier to interpret process diagrams as complete systems rather than as isolated shapes. The most important symbols are explained below.
Start / End (Terminator)
Meaning: Marks the beginning or end of a process.
Used in: Workflow start points, completed processes, closed loops.
Process
Meaning: Represents a task, action, or operational step in the process.
Used in: Business operations, procedure maps, task sequences.
Decision
Meaning: Indicates a branching point where the next step depends on a condition.
Used in: Approval flows, validation checks, rule-based routing.
Input / Output
Meaning: Shows information entering or leaving a process.
Used in: Data capture, reports, external inputs, generated outputs.
Connector
Meaning: Links one part of the diagram to another without drawing long crossing lines.
Used in: Large process maps, multi-step workflows, complex diagrams.
Document
Meaning: Represents a document or printed output associated with the process.
Used in: Reporting flows, approvals, recordkeeping steps.
Data Storage
Meaning: Represents stored information or a data repository used in the process.
Used in: System workflows, record storage, database-related process maps.
Predefined Process
Meaning: Represents a named process or subroutine that is defined elsewhere.
Used in: Reusable workflows, standardized procedures, modular process diagrams.
Process Flowchart Symbols Table
After reviewing the core symbols individually, the table below summarizes the meaning and typical use of the most common process flowchart symbols in one reference view.
| Process Symbol | Meaning | Used In |
|---|---|---|
| Start / End | Beginning or end of a workflow | Business processes, procedure maps, process summaries |
| Process | Action or task step | Operational workflows, SOP diagrams, work instructions |
| Decision | Conditional branching point | Approvals, validation flows, exception handling |
| Input / Output | Information entering or leaving the process | Data workflows, reporting processes, system interaction |
| Connector | Links separated parts of a chart | Complex diagrams, long workflows, cross-page flows |
| Document | Represents a document or printed output | Reports, forms, approvals, records |
| Data Storage | Stored information or repository | System workflows, stored records, databases |
| Predefined Process | Named process or reusable subroutine | Standardized procedures, modular workflows |
This summary also helps distinguish process-oriented notation from the broader symbol sets used in general diagramming. Once the core symbols are clear, the next step is understanding how process flowchart symbols differ in use and context from general flowchart notation.
Flowchart Symbols vs Process Flowchart Symbols
These terms are related, but they are not always used with the same intent. General flowchart symbols can support many kinds of diagrams, while process flowchart symbols are more tightly associated with business workflows, operational sequences, and structured process documentation.
| Flowchart Symbols | Process Flowchart Symbols |
|---|---|
| Used in general flowcharts | Used in process-focused workflow diagrams |
| Can describe logic, systems, or general sequences | Usually describe operational steps, handoffs, and business procedures |
| Broader educational or reference use | Stronger use in business process documentation |
| Often presented as a general symbol library | Often shown in context inside real process diagrams |
In practice, process flowchart symbols are a specialized application of the broader flowchart symbol standard. They are especially useful in process mapping, business process documentation, operations analysis, and workflow improvement. The best way to see that difference clearly is to look at real process diagrams built with these symbols.
In short: general flowchart symbols explain the broader notation system, while process flowchart symbols focus on documenting real operational workflows and business procedures.
Process Flow Diagram Examples
Reference charts explain individual symbols, but process flow diagrams show how process flowchart symbols work together inside a real workflow. The examples below move from symbol meaning to practical application and help connect symbol definitions with real process structure.

These simple flowchart examples demonstrate how standard symbols such as start/end, input/output, process, and decision are combined to describe logical workflows. They help readers see how individual shapes work together before moving to more complex process diagrams.

This process workflow example shows how process symbols can describe a real business sequence from customer consultation to payment completion. It is more process-focused than a basic algorithm flowchart and helps illustrate the operational use of decisions, process steps, and workflow direction.

This swimlane diagram demonstrates how process flowchart symbols can be used in a larger operational environment involving multiple departments. It helps explain how handoffs, decisions, procurement, production, and finance steps can all be represented within one structured business process map.

This import process example shows how a larger workflow can still remain readable when the symbol set is applied consistently. It helps explain how process steps, decisions, and transitions work together in a practical business diagram.
For more diagram layouts and practical use cases, see our collection of flowchart examples. Once the examples are clear, the next step is understanding how to use process symbols consistently in your own diagrams.
How to Use Process Symbols Correctly
Once the symbols are understood, the next step is using them consistently. Clear symbol discipline makes a process flow diagram easier to review, share, and maintain over time.
- Use one symbol type for one function throughout the diagram.
- Keep flow direction consistent, usually top-to-bottom or left-to-right.
- Label decisions clearly so branching logic is easy to follow.
- Use connectors when the process becomes too wide or visually crowded.
- Keep the diagram focused on real steps, not decorative elements.
For layout and readability recommendations, review our flowchart design best practices. Consistent symbol use makes process diagrams easier to read, review, and maintain across teams and over time.
Clear symbol conventions also support process mapping by reducing ambiguity and helping teams interpret decisions, handoffs, and outputs in the same way across a diagram.
Templates make that next step easier by turning symbol knowledge into a reusable process structure.
Process Flowchart Templates
Ready-made templates help teams create process diagrams faster and keep the visual structure consistent across similar workflows. They are especially useful for approvals, operations, onboarding, support, and reporting procedures.

This software library view shows where process flowchart templates and reusable diagram samples can be accessed. It supports the practical side of the page by showing how users can move from symbol knowledge to actual diagram creation.
The Flowcharts Solution includes symbol libraries and reusable templates for building process flow diagrams in a structured desktop environment.
Professional Flowchart Software
Process diagrams are easier to create and maintain when the software includes standard symbol libraries, reusable templates, and export options for documentation and collaboration.
If you are comparing tools for structured desktop diagramming, see our guide to professional flowchart software.
Download ConceptDraw DIAGRAM (21-day desktop trial)
No subscription required. Runs locally on Mac and Windows.
Why Standard Symbol Use Matters
Standard symbol use improves readability, reduces ambiguity, and makes process documentation easier to review across teams. Even when diagrams vary by industry or software, consistent symbol meaning remains one of the main reasons flowcharts stay understandable.
FAQ
What are process flowchart symbols?
Process flowchart symbols are standardized shapes used to represent steps, decisions, data movement, and connections in a process flow diagram.
What is the difference between flowchart symbols and process flowchart symbols?
Flowchart symbols is a broader category. Process flowchart symbols usually refer more specifically to shapes used in operational workflows, business processes, and procedure diagrams.
What symbol is used for a process step?
A rectangle is the standard symbol used to represent a process step or task.
What symbol is used for a decision?
A diamond is used for a decision point where the workflow branches based on a condition.
What is a process flow diagram?
A process flow diagram is a visual representation of how a process moves from one step to the next, including actions, decisions, and outcomes.
Where are process flowchart symbols used?
They are used in business process diagrams, workflow charts, operational documentation, system procedures, and process improvement projects.
Why are standard symbols important in process mapping?
Standard symbols make diagrams easier to read, compare, maintain, and share across teams.
How do I create a process flowchart?
Start by identifying the main steps, decisions, inputs, and outputs. Then place each step in sequence and connect the symbols with directional arrows.