Quality Control Chart Software — ISO Flowcharting
Quality Control Chart Software (ISO Flowcharting) - ConceptDraw DIAGRAM extended with Total Quality Management TQM Diagrams Solution from the Quality Management Area is the best diagramming and vector drawing software that allows you to draw the quality control charts quick and easy. The quality control chart is a graphic that illustrates the accordance of processes or products to the intended specifications and degree of differences from them. Depending on what type of data you need analyze, there are used different types of quality control charts: X-bar charts, S charts, Np charts.
 Bar Graphs
The Bar Graphs solution enhances ConceptDraw DIAGRAM functionality with templates, numerous professional-looking samples, and a library of vector stencils for drawing different types of Bar Graphs, such as Simple Bar Graph, Double Bar Graph, Divided Bar Graph, Horizontal Bar Graph, Vertical Bar Graph, and Column Bar Chart.
Business diagrams & Org Charts with ConceptDraw DIAGRAM
The business diagrams are in great demand, they describe the business processes, business tasks and activities which are executed to achieve specific organizational and business goals, increase productivity, reduce costs and errors. They let research and better understand the business processes. ConceptDraw DIAGRAM is a powerful professional cross-platform business graphics and business flowcharting tool which contains hundreds of built-in collections of task-specific vector stencils and templates. They will help you to visualize and structure information, create various Business flowcharts, maps and diagrams with minimal efforts, and add them to your documents and presentations to make them successful. Among them are Data flow diagrams, Organization charts, Business process workflow diagrams, Audit flowcharts, Cause and Effect diagrams, IDEF business process diagrams, Cross-functional flowcharts, PERT charts, Timeline diagrams, Calendars, Marketing diagrams, Pyramids, Target diagrams, Venn diagrams, Comparison charts, Analysis charts, Dashboards, and many more. Being a cross-platform application, ConceptDraw DIAGRAM is very secure, handy, free of bloatware and one of the best alternatives to Visio for Mac users.
 Dashboards Area
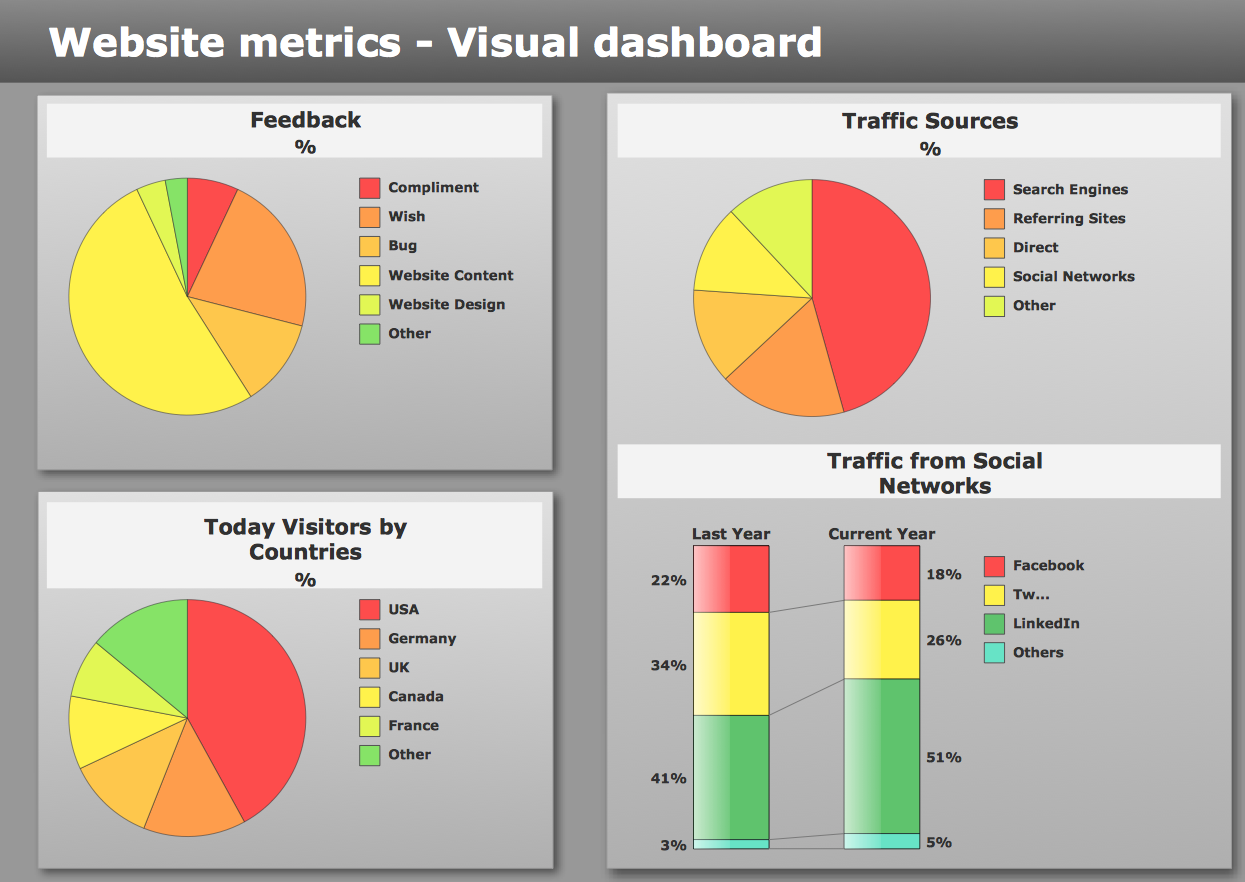
Solutions from the area Dashboards of ConceptDraw Solution Park collects templates, samples and vector stencils libraries with of data driven charts and indicators for drawing the basic types of Visual Dashboards.
HelpDesk
How to Create a Time Series Dashboard
Time Series Dashboard means integration of some type of diagrams: Line Charts, Bar Charts, Column Charts, and Dot Plots on a single space. The ConceptDraw Time Series Dashboard solution can be used to create the interactive Time Series dashboard. The libraries of Time Series Charts solution contain the Live Objects, that can change their appearance depending on the external data. Each chart from the Time Series dashboard displays particular source data. You can include Time Series Charts in your business or technical dashboards to show and compare the items changing over time.
 Comparison Dashboard
Comparison dashboard solution extends ConceptDraw DIAGRAM software with samples, templates and vector stencils library with charts and indicators for drawing the visual dashboard comparing data.
 Composition Dashboard
Composition dashboard solution extends ConceptDraw DIAGRAM software with templates, samples and vector stencils library with charts and indicators for drawing visual dashboards showing data composition.
 Time Series Dashboard
Time series dashboard solution extends ConceptDraw DIAGRAM software with templates, samples and vector stencils libraries with charts, graphs and plots for drawing the visual dashboards showing data time series.
HelpDesk
How to Draw a Divided Bar Chart
A divided bar graph is a rectangle divided into smaller rectangles along its length in proportion to the data. Segments in a divided bar represent a set of quantities according to the different proportion of the total amount. A divided bar diagram is created using rectangular bars to depict proportionally the size of each category. The bars in a divided bar graph can be vertical or horizontal. The size of each rectangle displays the part that each category represents. The value of the exact size of the whole must be known because each section of the bar displays a piece of that value. A divided bar diagram is rather similar to a sector diagram in that the bar shows the entire data amount and the bar is divided into several parts to represent the proportional size of each category. ConceptDraw DIAGRAM in conjunction with Divided Bar Diagrams solution provides tools to create stylish divided bar charts for your presentations.HelpDesk
How to Create a Meter Dashboard
The Time Series Dashboard Solution can be used to create the interactive Time Series Charts as Column Charts, Line Charts, or Bar Charts for your interactive dashboard.HelpDesk
How to Use ConceptDraw Sales Dashboard Solution
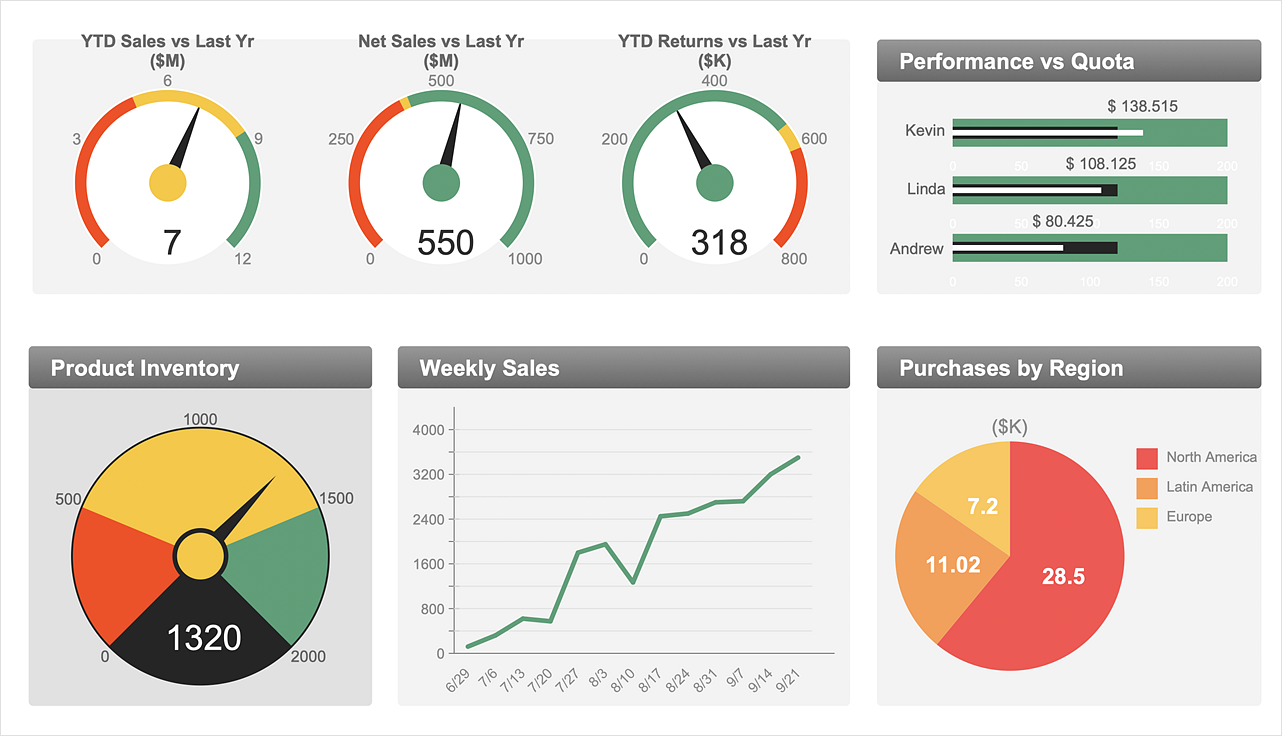
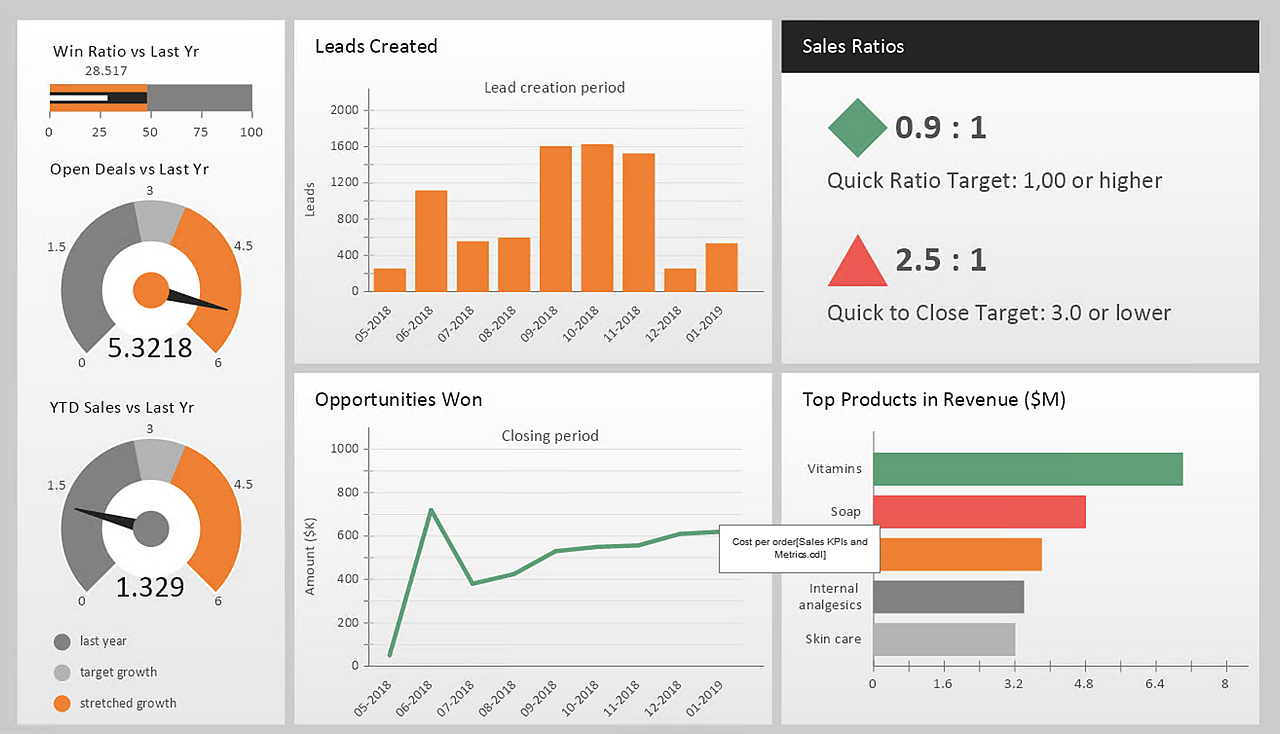
An interactive visual dashboard is a valuable tool for any sales team. Sales dashboard allows you to view and monitor sales indicators that are important for manager and sales staff. It helps to use timely and reliable information to improve the quality of sales performance and increase sales revenues. ConceptDraw Sales Dashboard solution is a tool for both: sales manager and sales team. It provides the visualization of key performance indicators that are critical to the entire sales organization. The custom sales dashboard displays real-time information on sales performance KPIs with the help of intuitive and easy-to-understand diagrams and charts. Sales Dashboard helps the entire team see where they are, and what needs to be done. With ConceptDraw DIAGRAM you can easily create a visual Sales Dashboard using Live Objects Technology.HelpDesk
How to Connect a Live Object to a Text Data Source
You can easily create a visual dashboard using charts and graphics indicators from Live Objects libraries. Here is an instruction on how to connect a ConceptDraw live object with data source files in TXT format to visualize the actual values of your performance metrics.HelpDesk
How to Create a Sales Dashboard
A visual dashboard is a valuable tool for any sales team. Sales dashboard allows you to view and monitor sales indicators that are important for manager and sales staff. It helps to use timely and reliable information to improve the quality of sales performance and increase sales revenues. ConceptDraw Sales Dashboard solution is a tool for both: sales manager and sales team. It provides the visualization of key performance indicators that are critical to the entire sales organization. The custom sales dashboard displays real-time information on sales performance KPIs with the help of intuitive and easy-to-understand diagrams and charts.- Bar Diagrams for Problem Solving. Create business management ...
- Total Quality Management TQM Diagrams
- Process Flowchart | How to Manage Problem Solving Using Seven ...
- Total Quality Management Business Diagram
- Seven Management and Planning Tools | Total Quality Management ...
- ConceptDraw Solution Park | Total Quality Management Value ...
- Tqm Chart
- Problem Solving Using Bar Charts
- Process Flowchart | Total Quality Management Definition | Definition ...
- Bar Diagrams for Problem Solving. Create manufacturing and ...
- Basic Flowchart Symbols and Meaning | Management Tools — Total ...
- Pyramid Diagram | Marketing Diagrams | Target and Circular ...
- How to Create a TQM Diagram Using Total Quality Management ...
- Concept Maps | Process Flowchart | Total Quality Management with ...
- TQM Diagram Example | TQM Diagram — Professional Total Quality ...
- TQM Diagram Tool | Total Quality Management Value | Quality ...
- Fishbone Diagram | Bar Diagrams for Problem Solving. Create ...
- Total Quality Management Value
- Schedule pie chart - Daily action plan | Think. Act. Accomplish ...
- Organizational Structure Total Quality Management | How to Create ...


