Lean Six Sigma Diagram Software
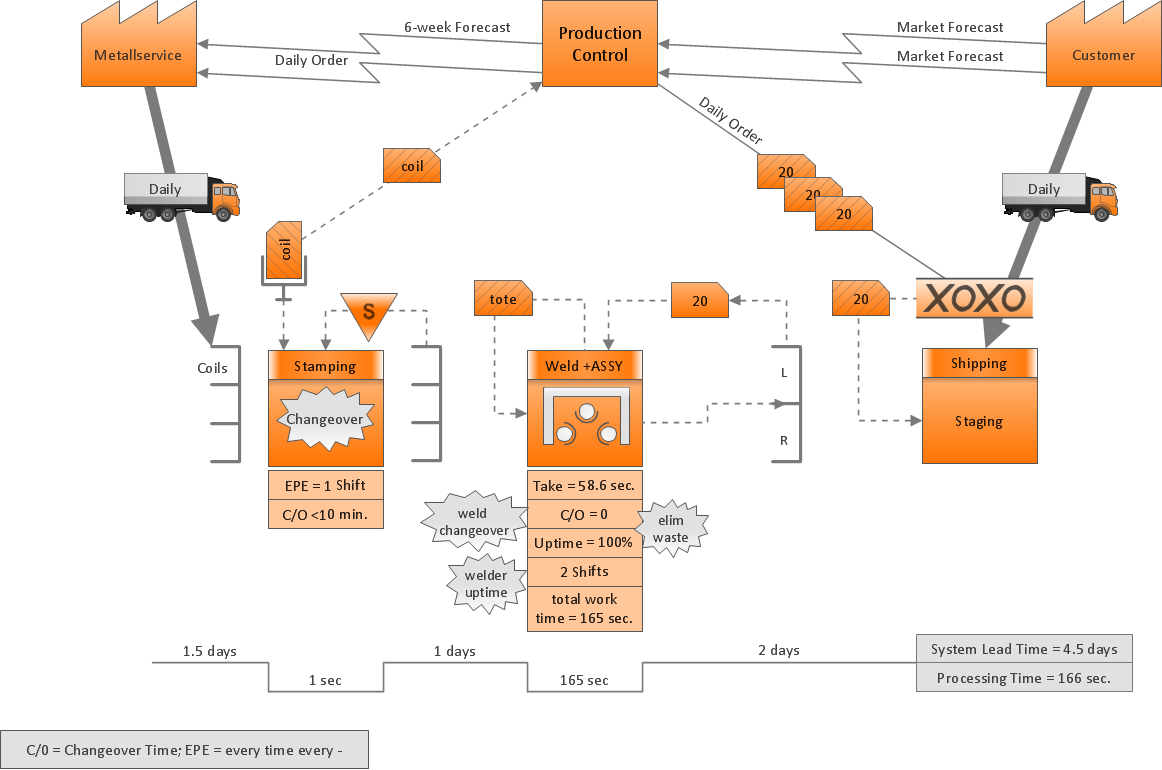
Lean Six Sigma (LSS) is a well-known in all over the world methodology of quality improvement and business perfection. ConceptDraw DIAGRAM diagramming and vector drawing software is a powerful Lean Six Sigma Diagram Software thanks to the included Value Stream Mapping solution from the Quality Management Area of ConceptDraw Solution Park.Lean Manufacturing Diagrams
The Value Stream Mapping solution continues to extend the range of ConceptDraw DIAGRAM into a business graphics tool that can be used to document processes of Lean Manufacturing.Value Stream Mapping - Design Elements
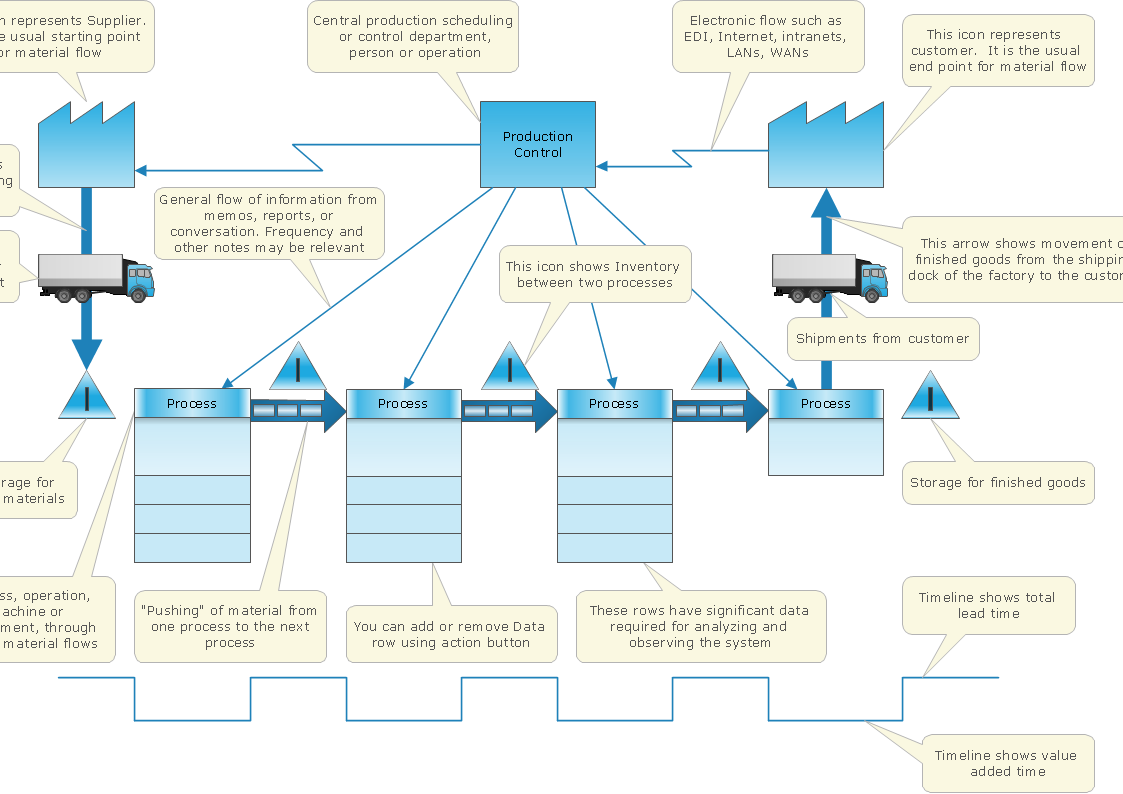
ConceptDraw DIAGRAM is a software for making Value Stream Mapping diagram with more than 10 library objects that are scalable vector images.Map Infographic Design
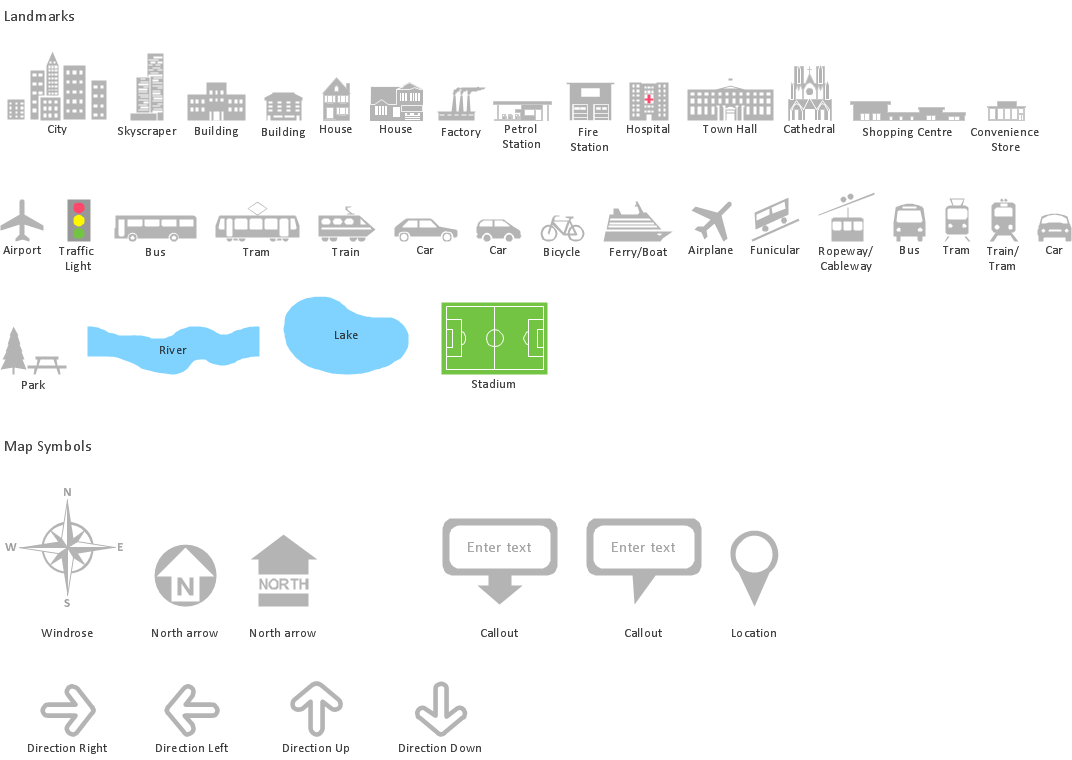
ConceptDraw collection of vector elements for infographics design.Value-Stream Mapping for Manufacturing
Create value stream maps - for value stream analysis and value stream management, material and information flow mapping, using our quick start templates included with ConceptDraw.Lean Value Stream Map
Lean Manufacturing tool is a new Value Stream Mapping solution found in the ConceptDraw Solution Park.Value Stream Diagram
The new Value Stream Mapping solution found in the ConceptDraw Solution Park continues to extend the range of ConceptDraw DIAGRAM into a business graphics tool.Lean Value Stream
ConceptDraw Value Stream Mapping is a Lean Manufacturing tool that uses a flow diagram to document in great detail every step of a manufacturing process.Corrective Action Planning
One of the stages of the problem's solving process scenario is Corrective Action Planning. Corrective action planning define people and groups involvement in corrective actions by roles, identify logical sequences of scheduled actions and critical path of problem solving, identify possible risks of action plan and propose preventive actions.
Quality Engineering Diagrams
Create Quality Engineering Diagrams (value stream maps) - for value stream analysis and value stream management, material and information flow mapping, using our quick start templates included with ConceptDraw.Value Stream Analysis
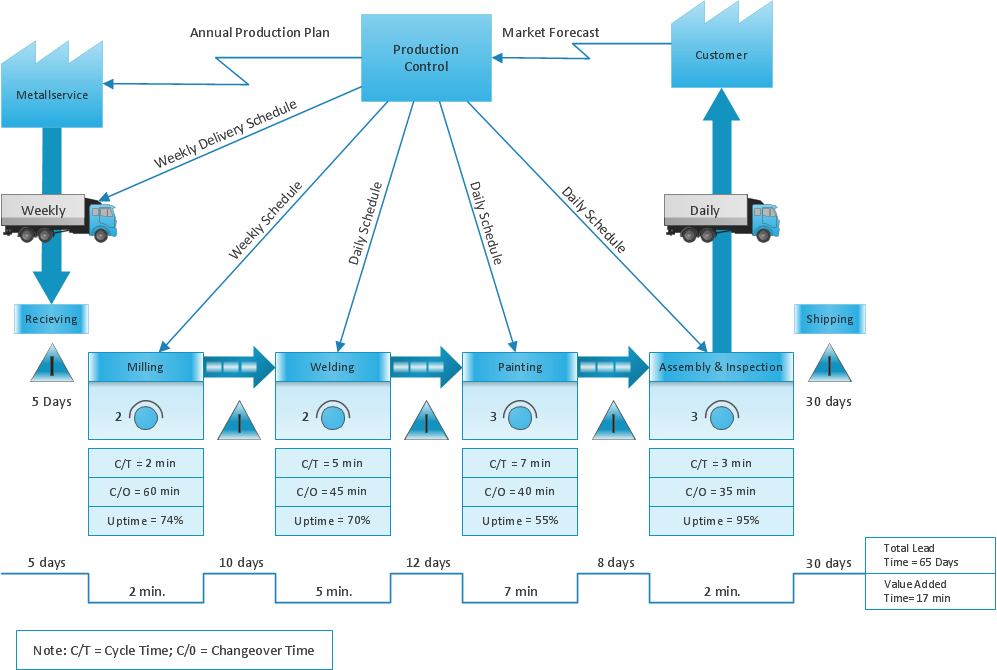
ConceptDraw Value Stream Maps are used in lean practice for analysis of manufacturing processes to identify the improvement opportunities.Learn how to create a current state value stream map
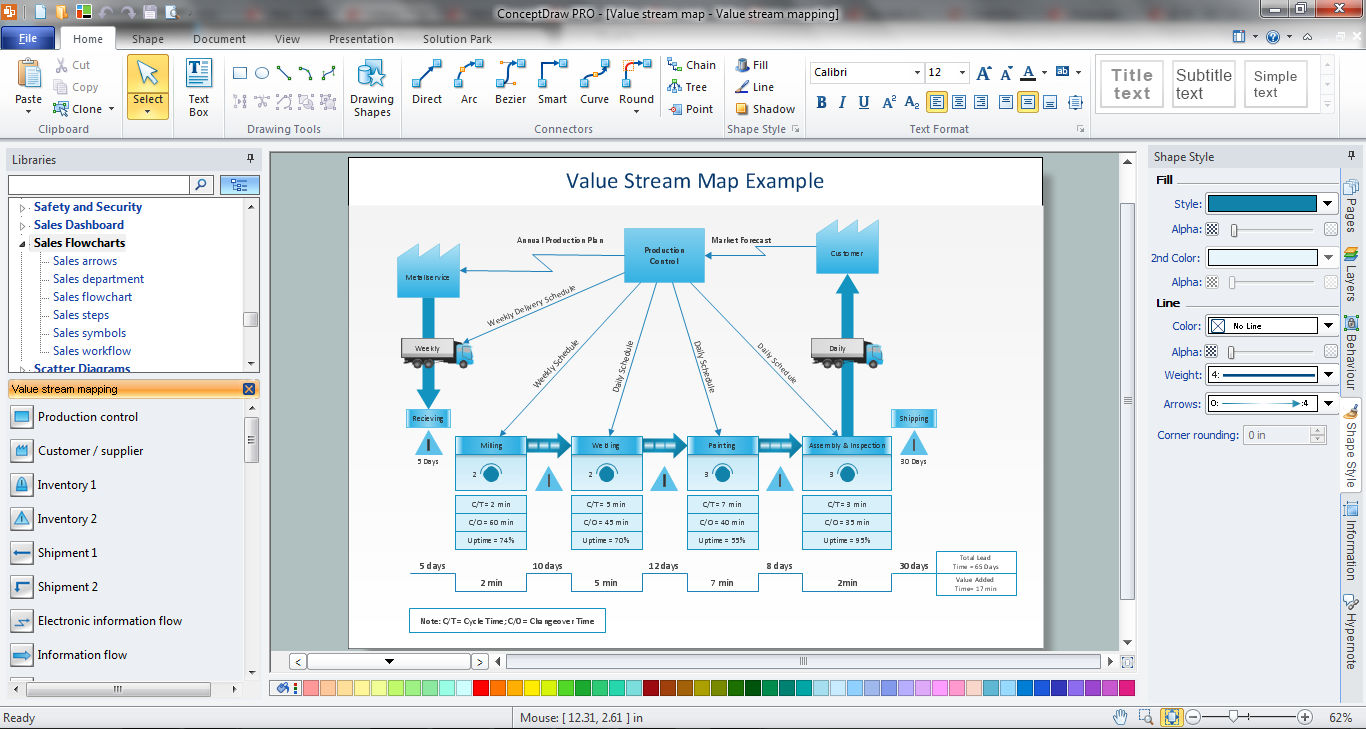
Value Stream Mapping solution extends ConceptDraw DIAGRAM software with templates, samples and vector shapes for drawing the current state value stream maps.Lean Manufacturing
Lean manufacturing or lean production is a concept of organization's management which is based on the constant effort to eliminate all kinds of losses. Lean manufacturing requires involvement of each employee in the process of business optimization and maximum customer orientation. ConceptDraw DIAGRAM diagramming and vector drawing software enhanced with Value Stream Mapping solution from the Quality area of ConceptDraw Solution Park is perfect for the lean manufacturing.Lean Value Stream Mapping
Value Stream Mapping solution assists practitioners of Lean Manufacturing in building Value Stream Mapping representations of processes.Business Process Flowchart
Cross-functional (deployment) flowcharts visualize what functional units (people, departments or functional areas) are responsible for the business process operations. The flowcharts are divided into rows/columns of functional units. Blocks of various shapes represent the process steps, and are placed in rows/columns of the responsible functional units.What is Value Stream Mapping?
Value stream maps (VSM) are an essential tool for organizations applying Lean methods.Value Stream Mapping Software
ConceptDraw DIAGRAM is a best Value Stream Mapping software. The graphical representation of a process is a powerful tool that helps in the diagnosis of process efficiency and allows companies to develop improved processes. The new Value Stream Mapping solution found in the ConceptDraw Solution Park continues to extend the range of ConceptDraw DIAGRAM into a business graphics tool that can be used to document processes in any organization.Value Stream Mapping Icons
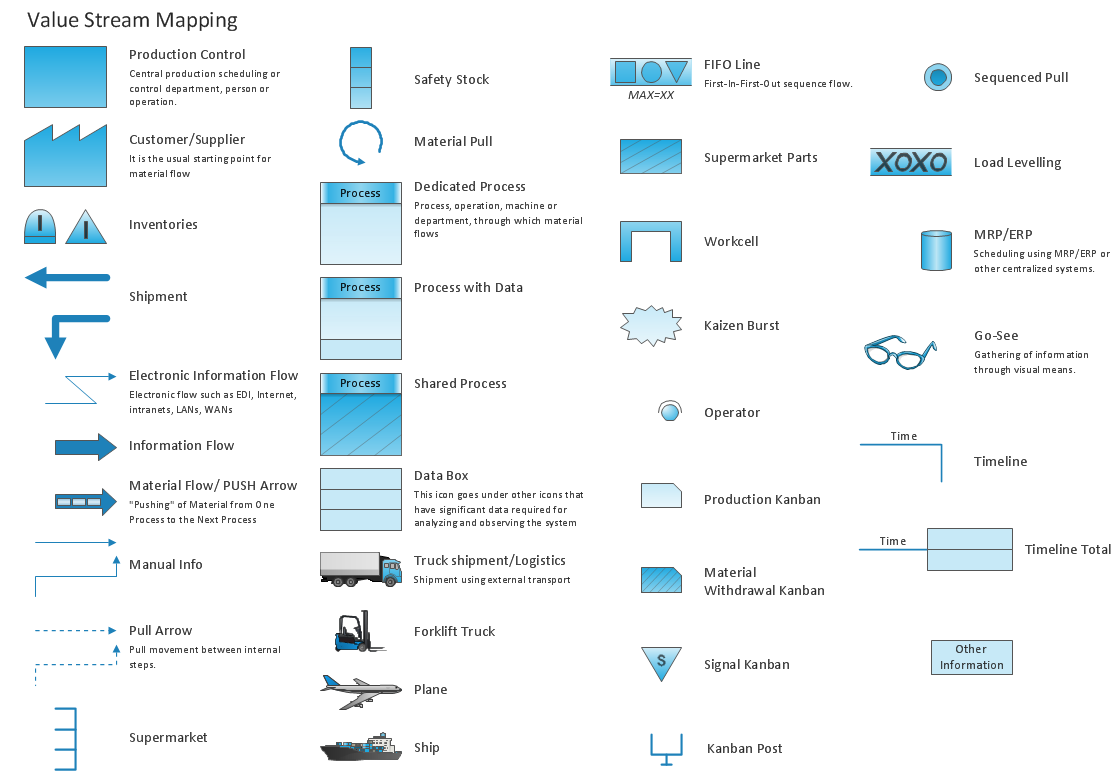
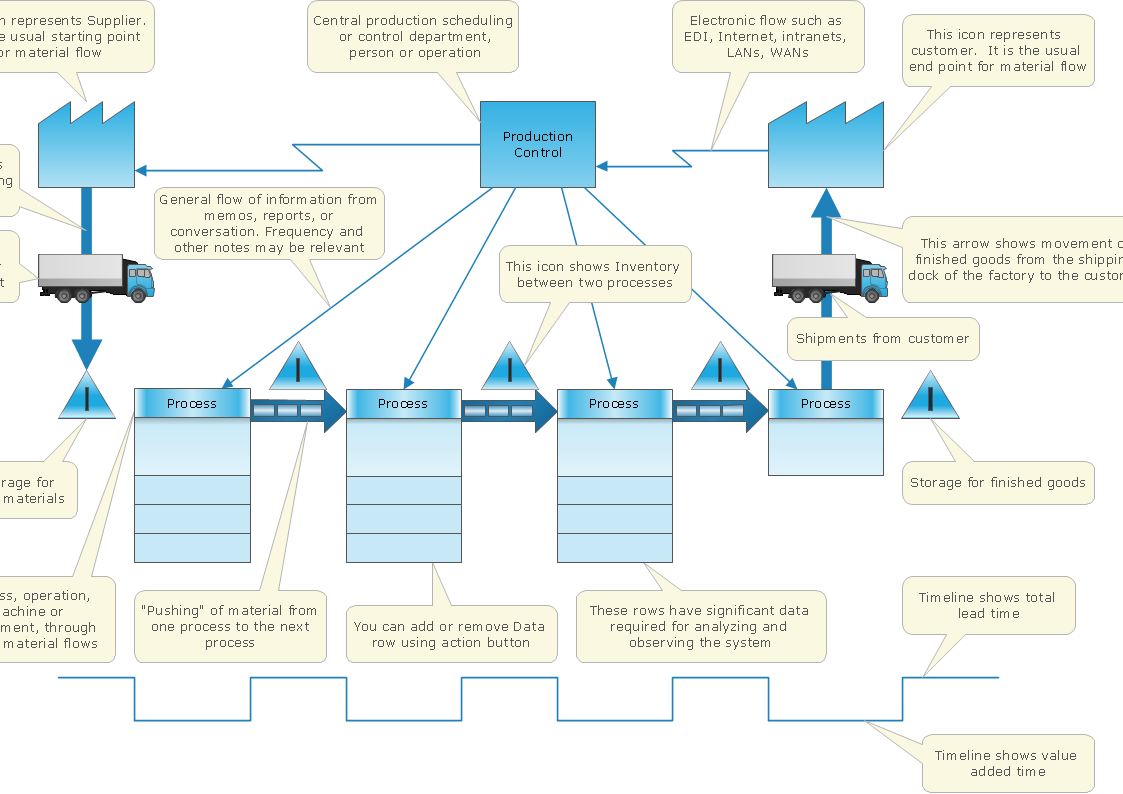
The library with 40 vector stencils is included in the ConceptDraw Value Stream Mapping solution.Integration Definition
Creation of various types of Integration DEFinition (IDEF) diagrams - IDEF0, IDEF1X, IDEF2, IDEF3 and many other is a sufficiently complex process that requires powerful automated tools. ConceptDraw DIAGRAM diagramming and vector drawing software offers you such tool - IDEF Business Process Diagrams solution from the Business Processes area of ConceptDraw Solution Park.Value Stream Mapping Presentations
Users can create Value Stream Mapping Presentations using presentation mode in ConceptDraw DIAGRAM.- Lean Manufacturing Diagrams | Value-Stream Mapping for ...
- TQM Diagram Tool | Picture Graphs | Seven Basic Tools of Quality ...
- Lean Six Sigma Diagram Software | Lean Manufacturing Diagrams ...
- Basic Flowchart Images . Flowchart Examples | Value Stream ...
- Manufacturing 8 Ms fishbone diagram - Template | Value-Stream ...
- Pictures For Quality
- Lean Manufacturing Diagrams | Manufacturing 8 Ms fishbone ...
- Tools - Vector stencils library | Masonry Tools And Their Uses With ...
- Lean Manufacturing Diagrams | Lean Value Stream Map | Value ...
- Blank Calendar | Bubble Chart | Lean Manufacturing Diagrams | Plot ...
- Fish Bone Diagram Production Tool
- Basic Flowchart Images . Flowchart Examples | Manufacturing and ...
- Cause and Effect Analysis - Fishbone Diagrams for Problem Solving ...
- TQM Diagram Example | Identifying Quality Management System ...
- Quality Control | Value-Stream Mapping for Manufacturing | TQM ...
- Vsm Symbols And Graph
- Graph Of Lean Manufacturing
- Total Quality Management Value | Fishbone Diagram | 4ms Of ...
- Process Flowchart | TQM Diagram Example | Definition TQM ...


