Business Process Modeling

 Business Process Diagrams
Business Process Diagrams solution extends the ConceptDraw PRO BPM software with RapidDraw interface, templates, samples and numerous libraries based on the BPMN 1.2 and BPMN 2.0 standards, which give you the possibility to visualize equally easy simple and complex processes, to design business models, to quickly develop and document in details any business processes on the stages of project’s planning and implementation.
"A value chain is a chain of activities that a firm operating in a specific industry performs in order to deliver a valuable product or service for the market. ...
The concept of value chains as decision support tools, was added onto the competitive strategies paradigm developed by Porter as early as 1979. In Porter's value chains, Inbound Logistics, Operations, Outbound Logistics, Marketing and Sales and Service are categorized as primary activities. Secondary activities include Procurement, Human Resource management, Technological Development and Infrastructure." [Value chain. Wikipedia]
This Porter's value chain matrix diagram example was created using the ConceptDraw PRO diagramming and vector drawing software extended with the Matrices solution from the Marketing area of ConceptDraw Solution Park.
Porter's value chain matrix

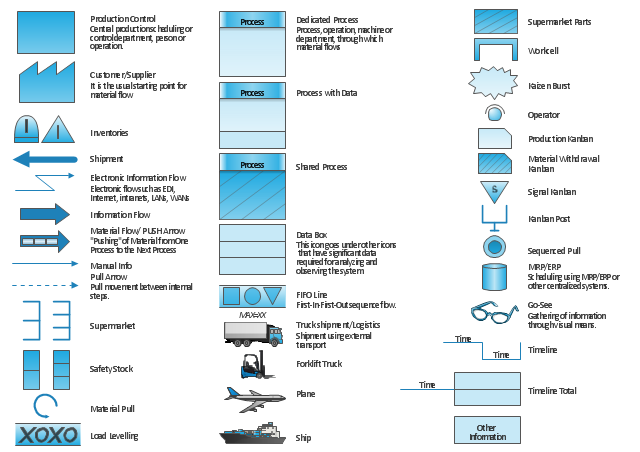
"Value stream mapping usually employs standard symbols to represent items and processes, therefore knowledge of these symbols is essential to correctly interpret the production system problems." [Value stream mapping. Wikipedia]
The vector stencils library Value stream mapping contains 43 symbols for drawing the value stream mapping diagrams using the ConceptDraw PRO diagramming and vector drawing software.
The example "Design elements - Value stream mapping diagram" is included in the Value Stream Mapping solution from the Quality area of ConceptDraw Solution Park.
VSM symbols
Process Flowchart


"Value Stream Map (VSM)
1. A tool used to improve a process by identifying added value and eliminating waste.
2. A process map that follows the value creation process.
A. “strap yourself to the product (or service) and see where you go”
3. A process map with data added.
A. Times: processing, wait, cycle.
B. Quality: number of rejects.
C. Inventory.
D. Resources.
1) Number of people.
2) Space.
3) Distance traveled.
E. Whatever else is useful for analyzing the process." [ocw.mit.edu/ courses/ aeronautics-and-astronautics/ 16-660j-introduction-to-lean-six-sigma-methods-january-iap-2012/ lecture-notes/ MIT16_ 660JIAP12_ 1-6.pdf]
This sample VSM flowchart shows the value stream in a manufacturing, production control and shipping processes.
This value stream mapping diagram example was created using the ConceptDraw PRO diagramming and vector drawing software extended with the Value Stream Mapping solution from the Quality area of ConceptDraw Solution Park.
Value stream mapping

Bar Diagrams for Problem Solving. Create event management bar charts with Bar Graphs Solution

Purchasing Flowchart - Purchase Order. Flowchart Examples

Business Models

Systems Engineering

Types of Flowcharts


This value stream map example was redesigned from the Wikipedia file: ValueStreamMapParts.png.
[en.wikipedia.org/ wiki/ File:ValueStreamMapParts.png]
This file is licensed under the Creative Commons Attribution-Share Alike 3.0 Unported license. [creativecommons.org/ licenses/ by-sa/ 3.0/ deed.en]
"Value stream mapping (VSM) refers to the activity of developing a visual representation of the flow of processes, from start to finish, involved in delivering a desired outcome, service, or product (a “value stream”) that is valued by customers. In the context of government, a value stream could be the process of conducting an audit, completing a procurement, or hiring new agency staff. VSM can increase understanding of actual decision-making processes and identify sources of non-value-added time (e.g., documents waiting to be reviewed). The typical products of a 2-5 day VSM workshop are a map of the “current state” of targeted processes and a “future state” map of the desired process flow and an associated implementation plan for future process improvement activities." [en.wikibooks.org/ wiki/ Business_ Analysis_ Guidebook/ LEAN]
The VSM diagram example "Value stream map parts" was created using the ConceptDraw PRO diagramming and vector drawing software extended with the Value Stream Mapping solution from the Quality area of ConceptDraw Solution Park.
Value stream mapping

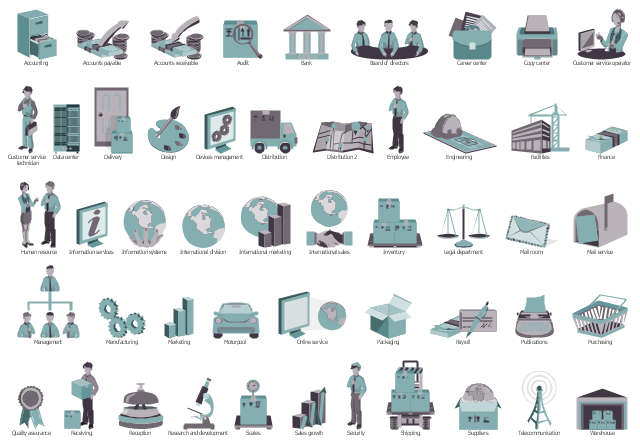
The vector stencils library "HR department" contains 49 department symbols.
Use it to design your HR flowcharts, workflow diagrams and process charts by the ConceptDraw PRO diagramming and vector drawing software.
"Functional departmentalization - Grouping activities by functions performed. Activities can be grouped according to function (work being done) to pursue economies of scale by placing employees with shared skills and knowledge into departments for example human resources, IT, accounting, manufacturing, logistics, and engineering. Functional departmentalization can be used in all types of organizations." [Departmentalization. Wikipedia]
The shapes example "Design elements - HR department" is included in the HR Flowcharts solution from the Management area of ConceptDraw Solution Park.
Department symbols for HR workflow diagrams
Business Process Modeling Software for Mac

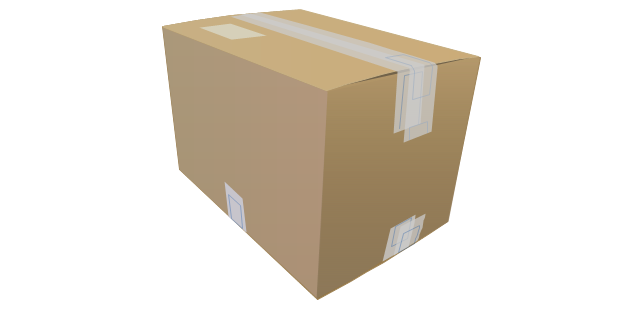
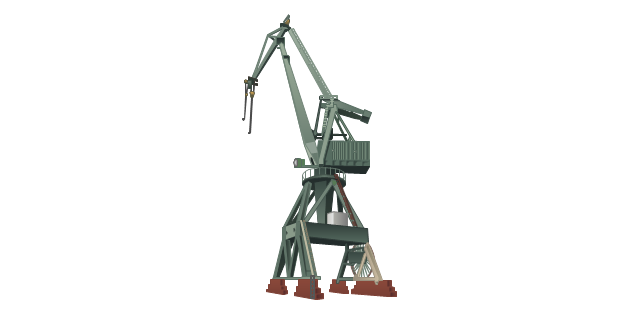
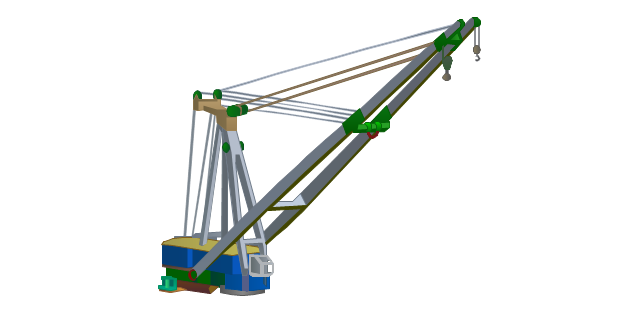
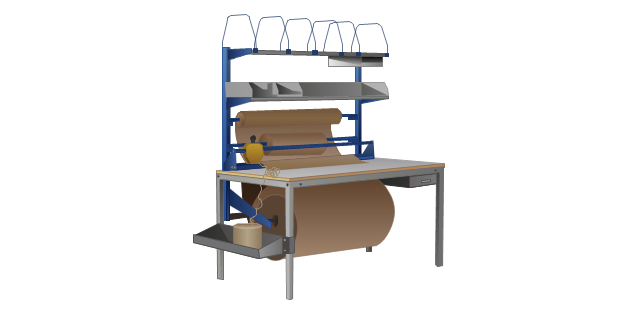
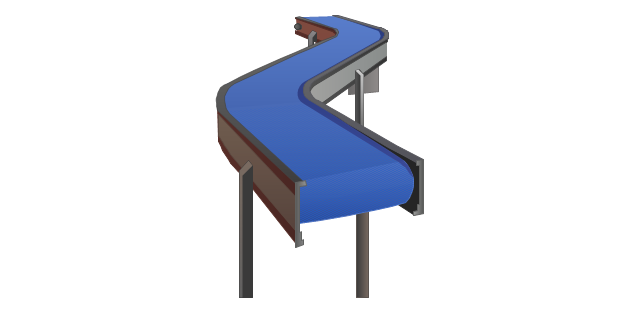
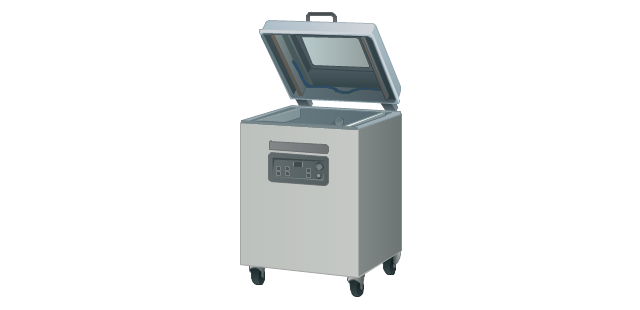
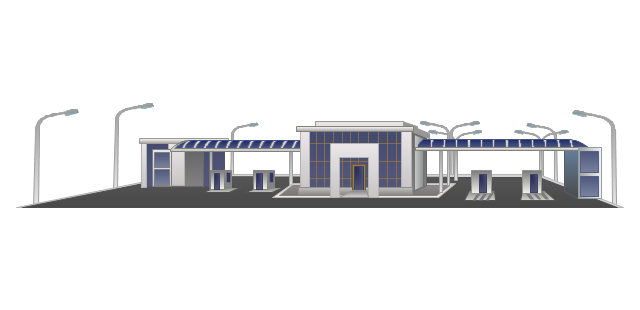
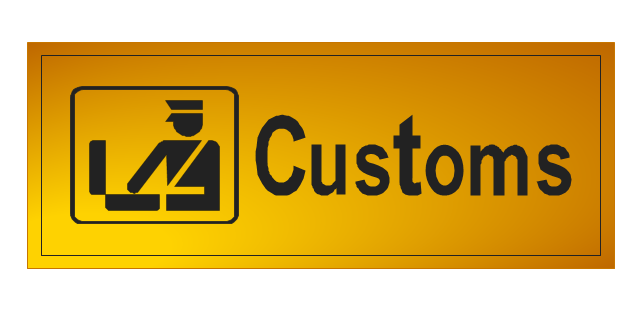
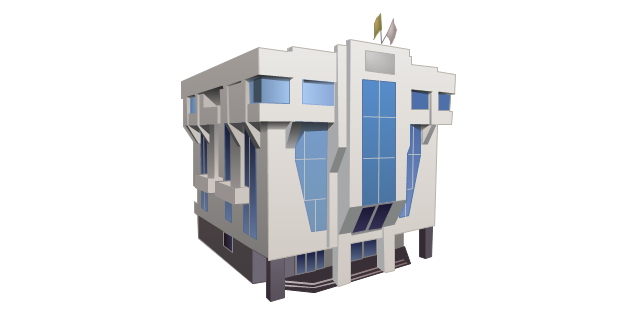
The vector stencils library "Packaging, loading, customs" contains 28 clipart images of packing materials and packaging equipment for drawing illustrations.
"Packaging is the technology of enclosing or protecting products for distribution, storage, sale, and use. Packaging also refers to the process of design, evaluation, and production of packages. Packaging can be described as a coordinated system of preparing goods for transport, warehousing, logistics, sale, and end use. Packaging contains, protects, preserves, transports, informs, and sells. In many countries it is fully integrated into government, business, institutional, industrial, and personal use." [Packaging and labeling. Wikipedia]
The clip art example "Packaging, loading, customs - Vector stencils library" was created in ConceptDraw PRO diagramming and vector drawing software using the Manufacturing and Maintenance solution from the Illustration area of ConceptDraw Solution Park.
Cardboard box
Cardboard box (open)
-packaging,-loading,-customs---vector-stencils-library.png--diagram-flowchart-example.png)
Paper bag

Woodgrain barrel
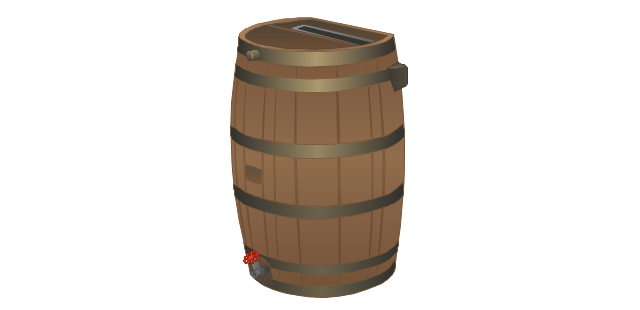
Barrel
Crate

Container
Handcart with cardboard box
Flatbed trolley
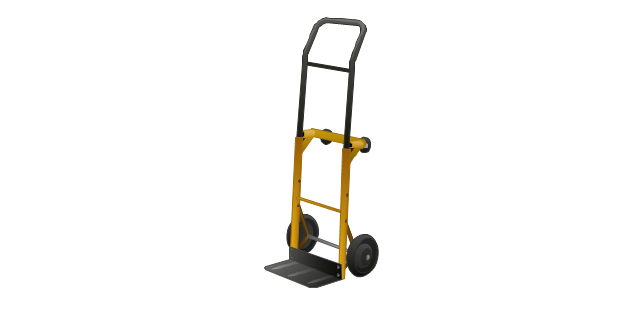
Hand truck
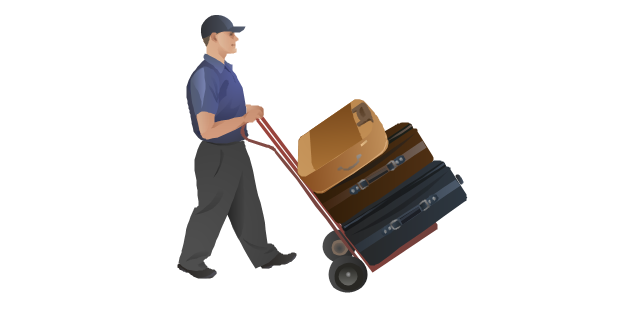
Porter
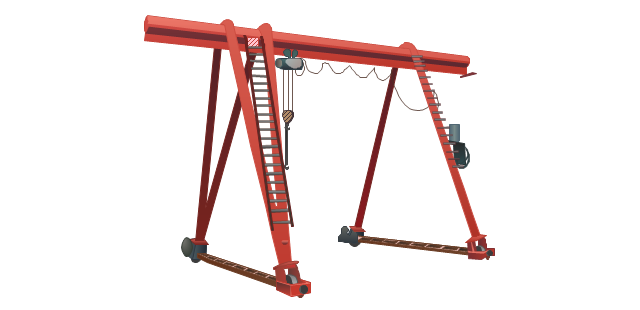
Gantry crane
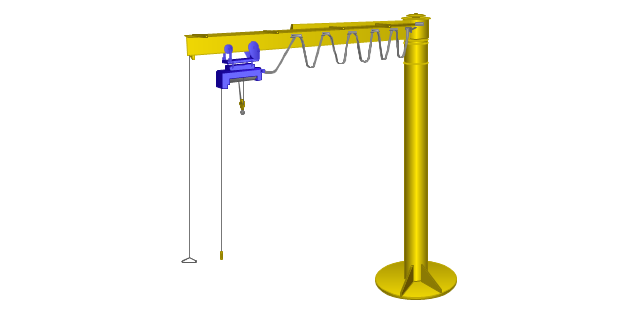
Jib crane
Level luffing crane
Deck crane
Packaging

Packaging machine
Packing conveyor
Vacuum packaging machine
State border sign

Border checkpoint
Customs sign
Border control

Port of entry office
Customs officer

Stocker with cardboard boxes

Warehouse workers

Pallet jack
- Flow chart Example. Warehouse Flowchart | Logistics ...
- Logistics - Choreography BPMN 2.0 diagram | Design elements ...
- Logistics - Choreography BPMN 2.0 diagram | Logistics ...
- Business Process Modeling | Choreography BPMN 2.0 diagram ...
- Workflow diagram - Earthquake disaster assessment | UML ...
- Logistics - Choreography BPMN 2.0 diagram | Logistics ...
- Logistics - Choreography BPMN 2.0 diagram
- Design elements - Conversations BPMN 2.0 | Logistics ...
- Choreography BPMN 2.0 diagram - Logistics | Conversation BPMN ...
- Business Process Modeling | Choreography BPMN 2.0 diagram ...
- Logistics - Choreography BPMN 2.0 diagram | Process Flowchart ...
- Logistics - Choreography BPMN 2.0 diagram | Business Process ...
- Logistics - Choreography BPMN 2.0 diagram | Advertising creation ...
- Cab booking public process - Collaboration BPMN 2.0 diagram ...
- Choreography BPMN 2.0 diagram - Logistics | Bpmn Choreography ...
- Process Flowchart | Value stream mapping diagram | Supermarket ...
- Business Process Modeling Software for Mac | Business Process ...
- Logistics Sample
- Design elements - Choreographies BPMN 2.0 | Design elements ...
- Value stream map example | Value stream mapping diagram | Value