 Event-driven Process Chain Diagrams
Event-driven Process Chain (EPC) Diagram is a type of flowchart widely used for modeling in business engineering and reengineering, business process improvement, and analysis. EPC method was developed within the Architecture of Integrated Information Systems (ARIS) framework.
 AWS Architecture Diagrams
The flexible AWS cloud solutions will help you to create reliable applications with a high level of scaling in the AWS cloud, to run your applications and accelerate their work on the level of security. Besides AWS resources are available worldwide and yo
 Entity-Relationship Diagram (ERD)
Entity-Relationship Diagram (ERD) solution extends ConceptDraw PRO software with templates, samples and libraries of vector stencils from drawing the ER-diagrams by Chen's and crow’s foot notations.
HelpDesk
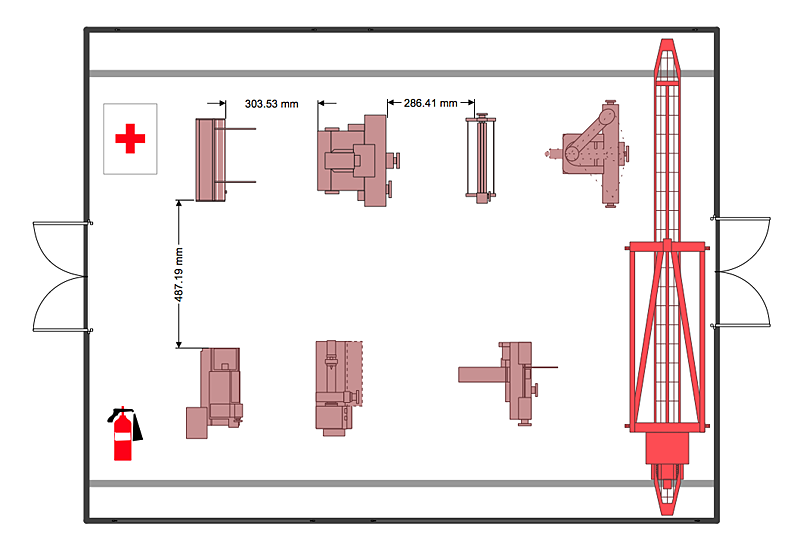
How to Create a Plant Layout Design
A plant construction process begins from a plant layout stage - an engineering stage used to design, analyze and finally choose the suitable configurations for a manufacturing plant. Plant Layout issues are core to any enterprise and are challenged in all types of manufacturing process. The sufficiency of layout influences the efficiency of subsequent operations.It is an important background for efficient manufacturing and also has a great deal with many questions. Once the place of the plant has been determined, the next important task before the management of the plant is to plan appropriate layout for the enterprise.
Plant layout is used to create the most effective physical arrangement of machinery and equipment, with the plant building in such a manner so as to make quickest and cheapest way from a raw material to the shipment of the completed product
Making a plan that shows the location of industrial equipment involves many different elements that can be managed using Con
 Fishbone Diagram
Fishbone Diagrams solution extends ConceptDraw PRO software with templates, samples and library of vector stencils for drawing the Ishikawa diagrams for cause and effect analysis.
 Value Stream Mapping
Value stream mapping solution extends ConceptDraw PRO software with templates, samples and vector stencils for drawing the Value Stream Maps (VSM) in lean manufacturing practice.
 Physics
Physics solution extends ConceptDraw PRO software with templates, samples and libraries of vector stencils for drawing the physical illustrations, diagrams and charts.
 Accounting Flowcharts
Accounting Flowcharts solution extends ConceptDraw PRO software with templates, samples and library of vector stencils for drawing the accounting flow charts.
 Computer and Networks Area
The solutions from Computer and Networks Area of ConceptDraw Solution Park collect samples, templates and vector stencils libraries for drawing computer and network diagrams, schemes and technical drawings.
 Fishbone Diagrams
The Fishbone Diagrams solution extends ConceptDraw PRO v10 software with the ability to easily draw the Fishbone Diagrams (Ishikawa Diagrams) to clearly see the cause and effect analysis and also problem solving. The vector graphic diagrams produced using this solution can be used in whitepapers, presentations, datasheets, posters, and published technical material.
 Area Charts
Area Charts are used to display the cumulative totals over time using numbers or percentages; or to show trends over time among related attributes. The Area Chart is effective when comparing two or more quantities. Each series of data is typically represented with a different color, the use of color transparency in an object’s transparency shows overlapped areas and smaller areas hidden behind larger areas.
 Health Food
The Health Food solution contains the set of professionally designed samples and large collection of vector graphic libraries of healthy foods symbols of fruits, vegetables, herbs, nuts, beans, seafood, meat, dairy foods, drinks, which give powerful possi
- Diagram Of A Simple Data Conversion Cycle
- Process Flowchart | Business diagrams & Org Charts with ...
- Process Flow Diagram Symbols | Process Flowchart | Process Flow ...
- Block Diagram | Process Flowchart | PM Planning | Blocks Diagram ...
- Process Flowchart | How to Draw a Block Diagram in ConceptDraw ...
- Function Organization Structure Block Diagram
- Process decision program chart (PDPC) - Personal activity | Process ...
- Best Diagramming Software for Mac | Flow chart Example ...
- Composition Conversion Of Graphics Pie Chart Pdf
- Functional Block Diagram | Cross-Functional Flowcharts | Cross ...
- Process decision program chart (PDPC) - Personal activity | Process ...
- Process Flowchart | Functional Block Diagram | Create Block ...
- Manufacturing Block Diagrams
- Cross-Functional Flowchart | Process Flowchart | Functional Flow ...
- Process Flowchart | Engineering | How to Draw an Organization ...
- Block Diagram | Process Flowchart | PM Planning | E Mail Block ...
- Illustration | Website Wireframe | Block Diagram | The Block Diagram ...
- Process Flowchart | Create Block Diagram | Block diagram - Selling ...
- Process Flowchart | Block Diagrams | Cross-Functional Flowchart ...
- Garrett IA Diagrams with ConceptDraw PRO | Diagramming tool ...
