"Decision-making can be regarded as the cognitive process resulting in the selection of a belief and/ or a course of action among several alternative possibilities. Every decision-making process produces a final choice that may or may not prompt action. ...
Decision-making can also be regarded as a problem-solving activity terminated by a solution deemed to be satisfactory. It is, therefore, a reasoning or emotional process which can be rational or irrational and can be based on explicit assumptions or tacit assumptions. Most decisions are followed by some form of cost-benefit analysis. Rational choice theory encompasses the notion that people try to maximize benefits while minimizing costs.
Some have argued that most decisions are made unconsciously, if not involuntarily. Jim Nightingale, author of Think Smart – Act Smart, states that "we simply decide without thinking much about the decision process. ...
A major part of decision-making involves the analysis of a finite set of alternatives described in terms of evaluative criteria. Information overload occurs when there is a substantial gap between the capacity of information and the ways in which people may or can adapt."" [Decision-making. Wikipedia]
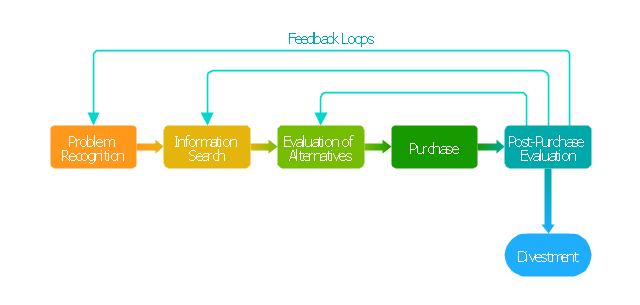
The block diagram example "Customer decision making" was created using the ConceptDraw PRO diagramming and vector drawing software extended with the Block Diagrams solution from the area "What is a Diagram" of ConceptDraw Solution Park.
Decision-making can also be regarded as a problem-solving activity terminated by a solution deemed to be satisfactory. It is, therefore, a reasoning or emotional process which can be rational or irrational and can be based on explicit assumptions or tacit assumptions. Most decisions are followed by some form of cost-benefit analysis. Rational choice theory encompasses the notion that people try to maximize benefits while minimizing costs.
Some have argued that most decisions are made unconsciously, if not involuntarily. Jim Nightingale, author of Think Smart – Act Smart, states that "we simply decide without thinking much about the decision process. ...
A major part of decision-making involves the analysis of a finite set of alternatives described in terms of evaluative criteria. Information overload occurs when there is a substantial gap between the capacity of information and the ways in which people may or can adapt."" [Decision-making. Wikipedia]
The block diagram example "Customer decision making" was created using the ConceptDraw PRO diagramming and vector drawing software extended with the Block Diagrams solution from the area "What is a Diagram" of ConceptDraw Solution Park.
Block diagram
HelpDesk
How to Create an Enterprise Architecture Diagram in ConceptDraw PRO

Workflow Diagram

How to Draw EPC Diagram Quickly
Diagram (Win, Mac)")

Basic Flowchart Symbols and Meaning


Process Flowchart


IDEF3 Standard

Risk Analysis


Marketing Flow Chart

Decision Making

HelpDesk
How to Draw a Fishbone Diagram with ConceptDraw PRO

 Audit Flowcharts
Audit flowcharts solution extends ConceptDraw PRO software with templates, samples and library of vector stencils for drawing the audit and fiscal flow charts.
 Marketing Diagrams
Marketing Diagrams solution extends ConceptDraw PRO diagramming software with abundance of samples, templates and vector design elements intended for easy graphical visualization and drawing different types of Marketing diagrams and graphs, including Branding Strategies Diagram, Five Forces Model Diagram, Decision Tree Diagram, Puzzle Diagram, Step Diagram, Process Chart, Strategy Map, Funnel Diagram, Value Chain Diagram, Ladder of Customer Loyalty Diagram, Leaky Bucket Diagram, Promotional Mix Diagram, Service-Goods Continuum Diagram, Six Markets Model Diagram, Sources of Customer Satisfaction Diagram, etc. Analyze effectively the marketing activity of your company and apply the optimal marketing methods with ConceptDraw PRO software.
How To Make the Right Decision in Projects


HelpDesk
How to Draw a Circular Arrows Diagram Using ConceptDraw PRO

HelpDesk
How to Draw a Pyramid Diagram in ConceptDraw PRO

Types of Flowcharts


HelpDesk
How To Create Cause and Effect (Fishbone) Diagram in MS Visio
 Diagram")
An Event-driven Process Chain (EPC) - flowchart used for business process modelling
 flowchart used for business process modelling")
 Block Diagrams
Block diagrams solution extends ConceptDraw PRO software with templates, samples and libraries of vector stencils for drawing the block diagrams.
- Block diagram - Customer decision making | Work Flow Diagrams ...
- Decision tree diagram | Decision Making | Influence Diagram ...
- Block diagram - Customer decision making | Block Diagrams | Work ...
- Decision Making | Block diagram - Customer decision making | Work ...
- Work Flow Diagrams with ConceptDraw PRO | IDEF3 Standard ...
- Making Mechanical Diagram | CAD Drawing Software for Making ...
- Pyramid Diagram
- Block diagram - Customer decision making | Influence Diagram ...
- Process decision program chart (PDPC) - Personal activity ...
- CORRECTIVE ACTIONS PLANNING Risk Diagram (PDPC ...
- Block diagram - Customer decision making | Total Quality ...
- Process decision program chart (PDPC) - Personal activity | Process ...
- Basic Diagramming | Create Block Diagram | Block diagram ...
- Block diagram - Customer decision making | Basic Flowchart ...
- Process decision program chart (PDPC) - Personal activity | Process ...
- Block Diagrams | Create Block Diagram | Basic Diagramming | Block ...
- Cross-Functional Flowchart | Business Productivity Area | Process ...
- Block diagram - Gap model of service quality | Block diagram ...
- How to Draw an Organization Chart | Organizational Structure ...
- Sales Dashboard | Event-driven Process Chain Diagrams EPC ...