HelpDesk
How to Create a TQM Diagram
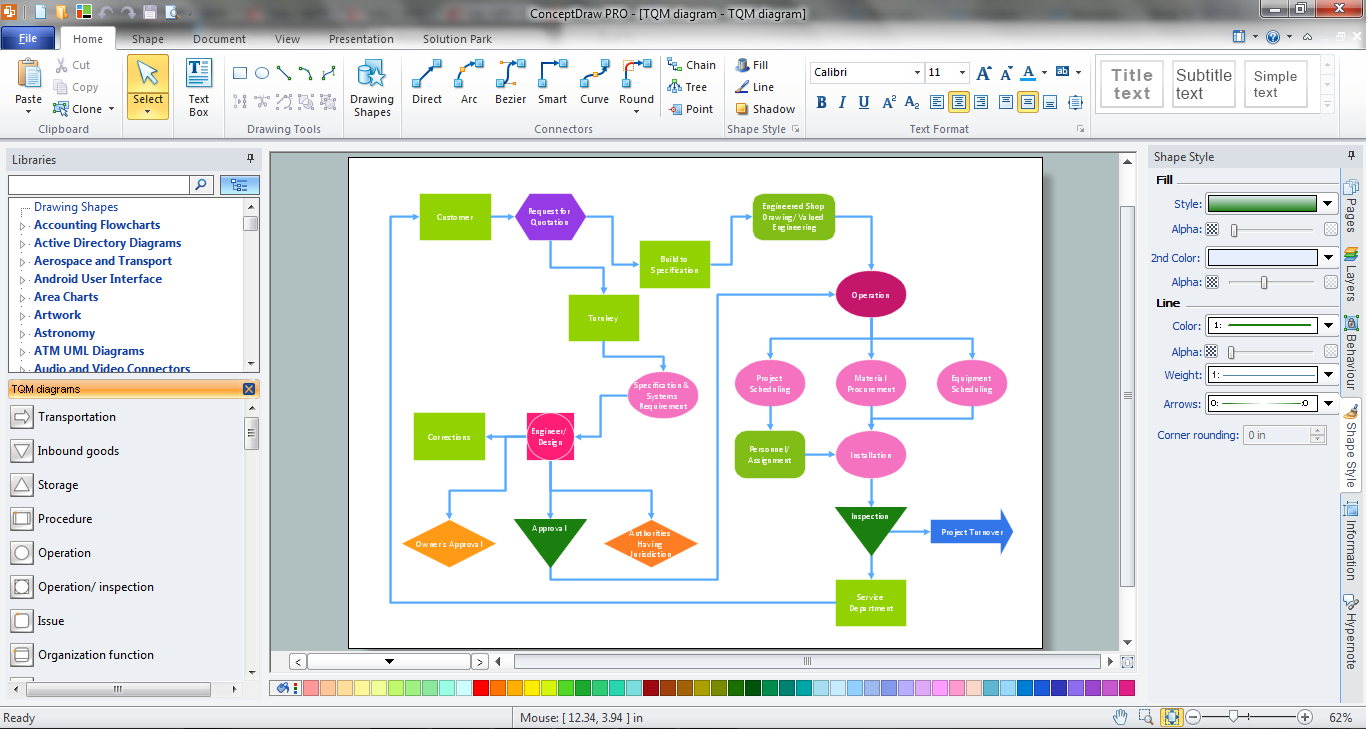
TQM diagrams, created with ConceptDraw tools can be used for developing improvement plans and quality solutions in a bushiness organization.Total Quality Management Value
The Total quality management (TQM) is an enterprise-wide method of continuous quality improvement of all organizational processes, including the enhancement of ability to deliver high-quality products and services to the customers. The TQM includes eight main elements, which have great value: customer-focused, process-centered, total employee involvement, integrated system, continual improvement, strategic and systematic approach, fact-based decision making, communications. ConceptDraw PRO diagramming and vector drawing software offers the Total Quality Management Diagram solution with effective drawing tools, predesigned vector elements, samples and templates that help easy design the Total Quality Management diagrams, TQM flowcharts and Mind Maps widely used in quality management projects to visualize the business processes and industrial processes for your organization, to demonstrate the quality control step-by-step in a visual manner, to compare visually the ideal and real stages of processes.Process Flowchart
The main reason of using Process Flowchart or PFD is to show relations between major parts of the system. Process Flowcharts are used in process engineering and chemical industry where there is a requirement of depicting relationships between major components only and not include minor parts. Process Flowcharts for single unit or multiple units differ in their structure and implementation. ConceptDraw PRO is Professional business process mapping software for making Process flowcharts, Process flow diagram, Workflow diagram, flowcharts and technical illustrations for business documents and also comprehensive visio for mac application. Easier define and document basic work and data flows, financial, production and quality management processes to increase efficiency of your business with ConcepDraw PRO. Business process mapping software with Flowchart Maker ConceptDraw PRO includes extensive drawing tools, rich examples and templates, process flowchart symbols and shape libraries, smart connectors that allow you create the flowcharts of complex processes, process flow diagrams, procedures and information exchange. Process Flowchart Solution is project management workflow tools which is part ConceptDraw Project marketing project management software. Drawing charts, diagrams, and network layouts has long been the monopoly of Microsoft Visio, making Mac users to struggle when needing such visio alternative like visio for mac, it requires only to view features, make a minor edit to, or print a diagram or chart. Thankfully to MS Visio alternative like ConceptDraw PRO software, this is cross-platform charting and business process management tool, now visio alternative for making sort of visio diagram is not a problem anymore however many people still name it business process visio tools.
 Total Quality Management TQM Diagrams
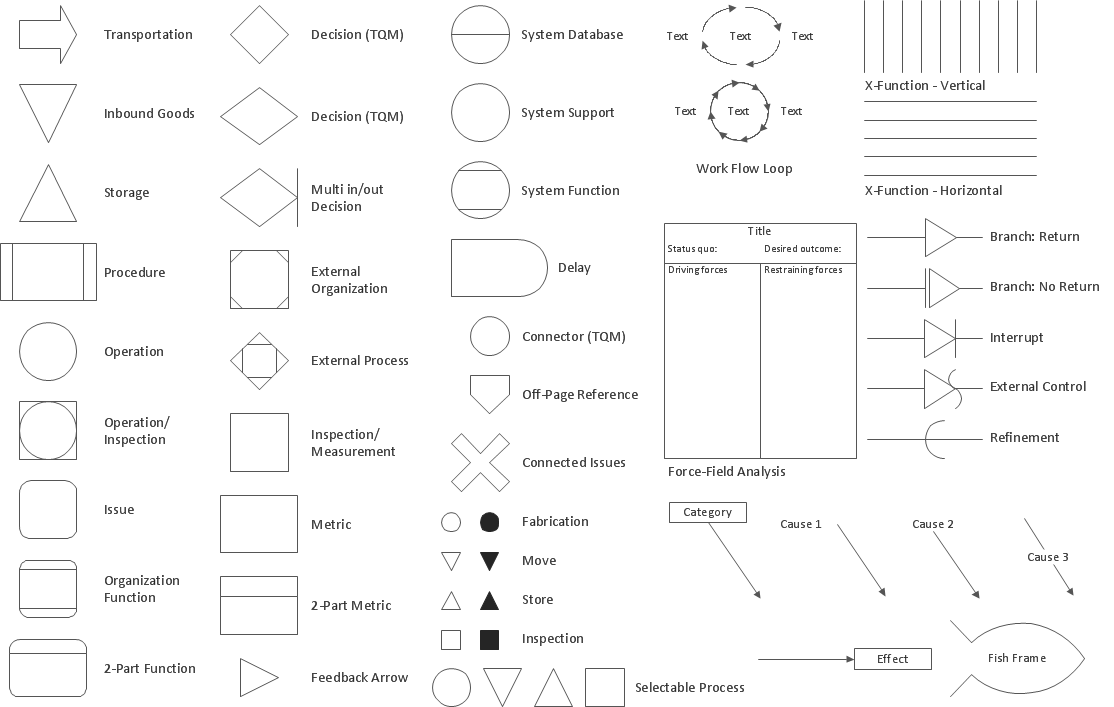
Total Quality Management Diagrams solution extends ConceptDraw PRO software with samples, templates and vector stencils library for drawing the TQM flowcharts.
Total Quality Management with ConceptDraw
Total Quality Management (TQM) system is the management method where the confidence in quality of all organization processes is placed foremost. The given method is widely used in production, in educational system, in government organizations and so on.TQM Software
ConceptDraw PRO diagramming and vector drawing software extended with Total Quality Management (TQM) Diagrams solution from the Quality area of ConceptDraw Solution Park is a powerful TQM software.The Fifty Two Elements of TQM
The Total Quality Management Diagram solution helps your organization visualize business and industrial processes. Create Total Quality Management diagrams for business process with ConceptDraw software.TQM Diagram Tool
The Total Quality Management Diagram solution helps you and your organization visualize business and industrial processes. Create Total Quality Management diagrams for business process with ConceptDraw software.Probability Quality Control Tools
The Total Quality Management Diagram solution helps your organization visualize business and industrial processes. Create Total Quality Management diagrams for business process with ConceptDraw software.Management Tools — Total Quality Management
The Total Quality Management Diagram solution helps your organization visualize business and industrial processes. Create Total Quality Management diagrams for business process with ConceptDraw software.Total Quality Management
ConceptDraw PRO diagramming and vector drawing software extended with Total Quality Management (TQM) Diagrams solution from the Quality area of ConceptDraw Solution Park is effective software for Total Quality Management.Best Multi-Platform Diagram Software
ConceptDraw PRO is a powerful tool for drawing business communication ideas and concepts, simple visual presentation of numerical data in the Mac environment.Quality Control Chart Software — ISO Flowcharting
Quality Control Chart Software (ISO Flowcharting) - ConceptDraw PRO extended with Total Quality Management TQM Diagrams Solution from the Quality Management Area is the best diagramming and vector drawing software that allows you to draw the quality control charts quick and easy. The quality control chart is a graphic that illustrates the accordance of processes or products to the intended specifications and degree of differences from them. Depending on what type of data you need analyze, there are used different types of quality control charts: X-bar charts, S charts, Np charts.HelpDesk
How to Create an IDEF0 Diagram for an Application Development
IDEF0 methods are intended to model the functions of a process, creating a graphical model that displays: what controls the function, who makes it, what resources are used and how they are connected with other functions. The IDEF0 tool is used to model the decisions, actions, and activities of a software system during the development process . IDEF0 diagram graphically depicts a model of a desired version of the application. ConceptDraw PRO allows you to create and communicate the IDEF0 diagrams of any complexity.Simple & Fast Diagram Software
It is so simple making the drawing process easier and faster. you just need to choose the right drawing software. ConceptDraw Arrows10 Technology - This is so easy and fast to draw any type of diagram with any degree of complexity.
- Drawing Of Total Quality Management Model
- Draw Model Of Tqm
- Tqm Flowchart Example
- Marketing Diagrams | Pyramid Diagram | Target and Circular ...
- Circular Arrows Diagrams | Total Quality Management TQM ...
- Organizational Structure Total Quality Management | Process ...
- Total Quality Management TQM Diagrams
- Flow Chart Symbols | Design elements - TQM diagram | Cross ...
- Arrow Diagram Tqm Management
- Flow Chart Symbols | Design elements - TQM diagram | Flowcharts ...
- Flow Chart Symbols | Design elements - TQM diagram | Cross ...
- Flow Chart Symbols | Design elements - TQM diagram | IDEF0 ...
- Tqm Model Diagram And Explanation
- Quality Management Tools | TQM Tools | TQM Software | Draw ...
- Business Process Management | Total Quality Management TQM ...
- Flow Chart Symbols | Design elements - TQM diagram | Flowcharts ...
- Tqm Chart
- Design elements - TQM diagram | Cross-Functional Flowcharts ...
- Network Diagram Software (PRO) | Network Drawing Software ...
- Total Quality Management TQM Diagrams | Active Directory ...


