 ConceptDraw Solution Park
ConceptDraw Solution Park collects graphic extensions, examples and learning materials
Sample Project Flowchart. Flowchart Examples
This sample shows the Flowchart that displays the architecture of SQL Exception Translation. This sample was created in ConceptDraw PRO diagramming and vector drawing software using the Flowcharts solution from the What is a Diagram area of ConceptDraw Solution Park.
Scientific Symbols Chart
ConceptDraw PRO is the beautiful design software that provides many vector stencils, examples and templates for drawing different types of illustrations and diagrams.Mathematics Solution from the Science and Education area of ConceptDraw Solution Park includes a few shape libraries of plane, solid geometric figures, trigonometrical functions and greek letters to help you create different professional looking mathematic illustrations for science and education.
 Audio and Video Connectors
The Audio and Video Connectors solution contains a set of video connectors, audio connectors and s video connection; you will also find pre-designed objects, libraries, templates, and samples, allowing quick and easy diagramming of various configurations
 Picture Graphs
Typically, a Picture Graph has very broad usage. They many times used successfully in marketing, management, and manufacturing. The Picture Graphs Solution extends the capabilities of ConceptDraw PRO v10 with templates, samples, and a library of professionally developed vector stencils for designing Picture Graphs.
 Value Stream Mapping
Value stream mapping solution extends ConceptDraw PRO software with templates, samples and vector stencils for drawing the Value Stream Maps (VSM) in lean manufacturing practice.
3 Circle Venn Diagram. Venn Diagram Example
This template shows the Venn Diagram. It was created in ConceptDraw PRO diagramming and vector drawing software using the ready-to-use objects from the Venn Diagrams Solution from the "What is a Diagram" area of ConceptDraw Solution Park. Venn Diagrams visualize all possible logical intersections between several sets and are widely used in mathematics, logic, statistics, marketing, sociology, etc.Circles Venn Diagram
This example shows the 4 Circle Venn Diagram. The Venn Diagram visualizes all possible logical relations between several sets. The sets are represented as circles on the Venn Diagram. On this example you can see the intersections of 4 sets. Venn Diagrams are widely used in mathematics, logic, statistics, marketing, sociology, etc.Basic Circles Venn Diagram. Venn Diagram Example
Venn Diagrams visualize all possible logical relations between several sets and are widely used in mathematics, logic, statistics, marketing, sociology, etc. This Venn Diagram shows the relative complement of the set A with respect to the set B. It is the set of the elements in B, but not in A. In other words it is the set-theoretic difference B-A.2 Circle Venn Diagram. Venn Diagram Example
Using the ready-to-use predesigned objects, samples and templates from the Venn Diagrams Solution for ConceptDraw PRO you can create your own professional looking Venn Diagrams quick and easy.
 Holiday
The Holiday Solution from Illustration area of ConceptDraw Solution Park contains holiday illustration examples, templates and vector clipart library.
Multi Layer Venn Diagram. Venn Diagram Example
To visualize the relationships between subsets of the universal set you can use Venn diagrams. To construct one, you should divide the plane into a number of cells using n figures. Each figure in the chart represents a single set of, and n is the number of represented sets. Splitting is done in a way that there is one and only one cell for any set of these figures, the points of which belong to all the figures from the set and do not belong to others. The plane on which the figures are represented, is the universal set U. Thus, the point which does not belong to any of the figures, belongs only to U.
 Vehicular Networking
Network engineering is an extensive area with wide range of applications. Depending to the field of application, network engineers design and realize small networks or complex networks, which cover wide territories. In latter case will be ideal recourse to specialized drawing software, such as ConceptDraw PRO.
 Marketing Diagrams
This solution extends ConceptDraw PRO with samples, templates and library of design elements for drawing the marketing diagrams.
Nature Drawings - How to Draw
Nature solution expands this software possibilities to create beautiful illustrations diagrams with the new library which contains 17 vector objects.
 Spatial Infographics
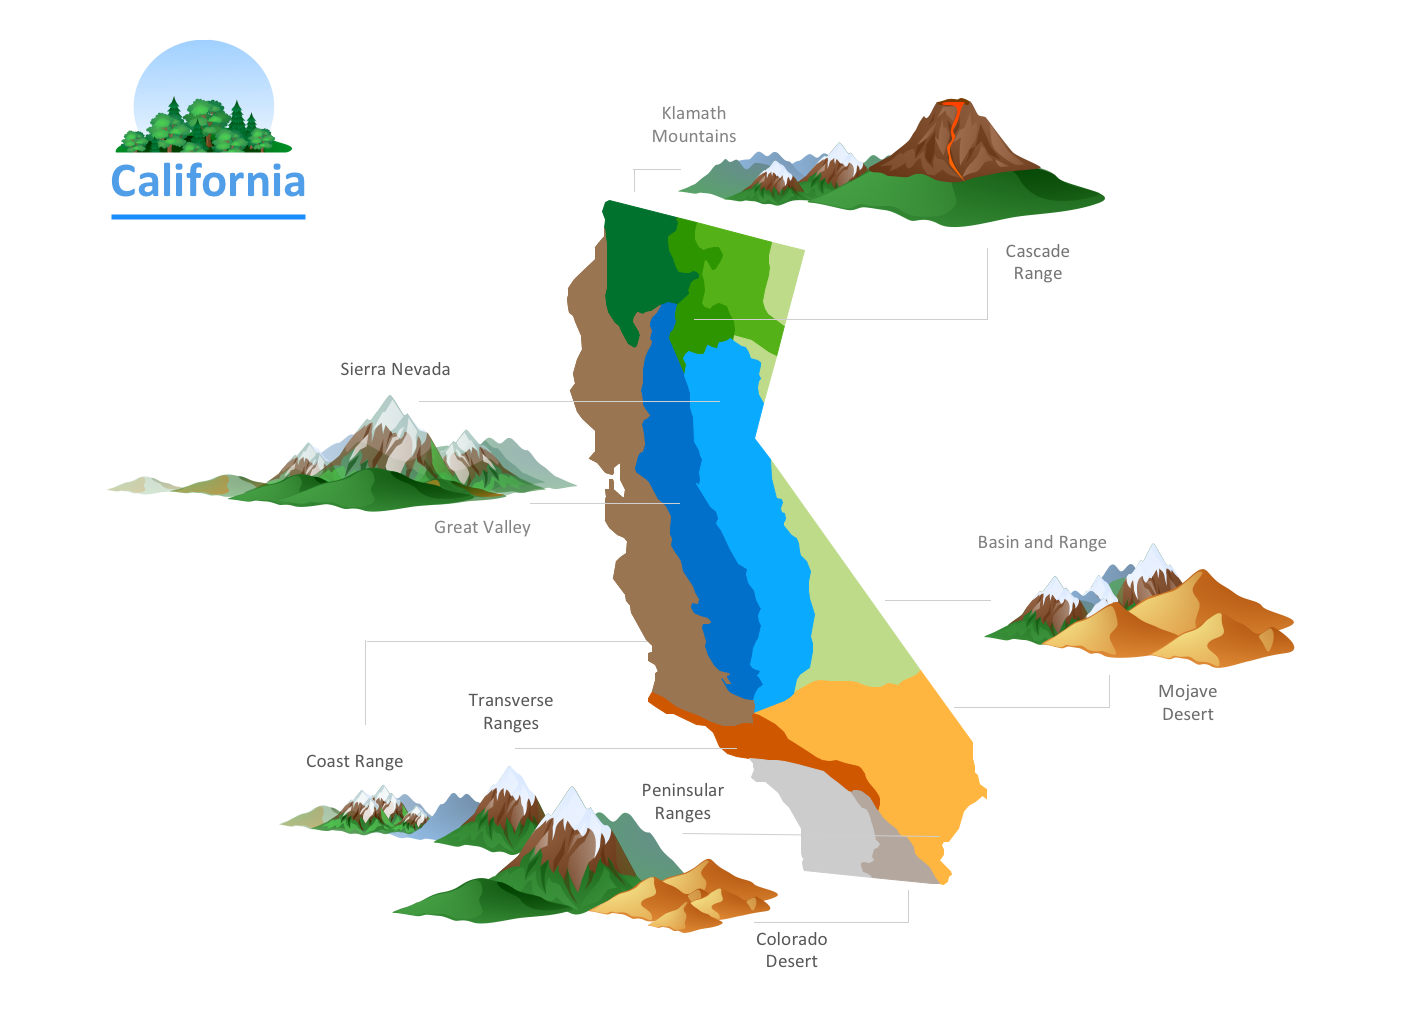
Spatial infographics solution extends ConceptDraw PRO software with infographic samples, map templates and vector stencils libraries with design elements for drawing spatial information graphics.
Flowchart Software
The Flowcharts are popular and widely used for designing, documenting, managing and analyzing the complex processes and programs in various fields, such as science, business, engineering, architecture, manufacturing, administration, and many others. To design professional looking Flowchart Diagrams we recommend to use the ConceptDraw PRO diagramming and vector drawing software extended with set of Flowchart maker solutions from the What is a Diagram, Finance and Accounting, Marketing, and Business Processes areas of ConceptDraw Solution Park. ConceptDraw PRO flowchart software is rich for the libraries of ready-to-use predesigned vector flowchart objects, templates, samples and examples, which make it the best choice for designing the Flowcharts of any type and style. Besides, the ConceptDraw documents with Flowchart Diagrams are vector graphic documents, available for reviewing, modifying and converting to different popular formats: image, HTML, PDF file, MS PowerPoint Presentation, Adobe Flash or MS Visio XML.Management - Design Elements
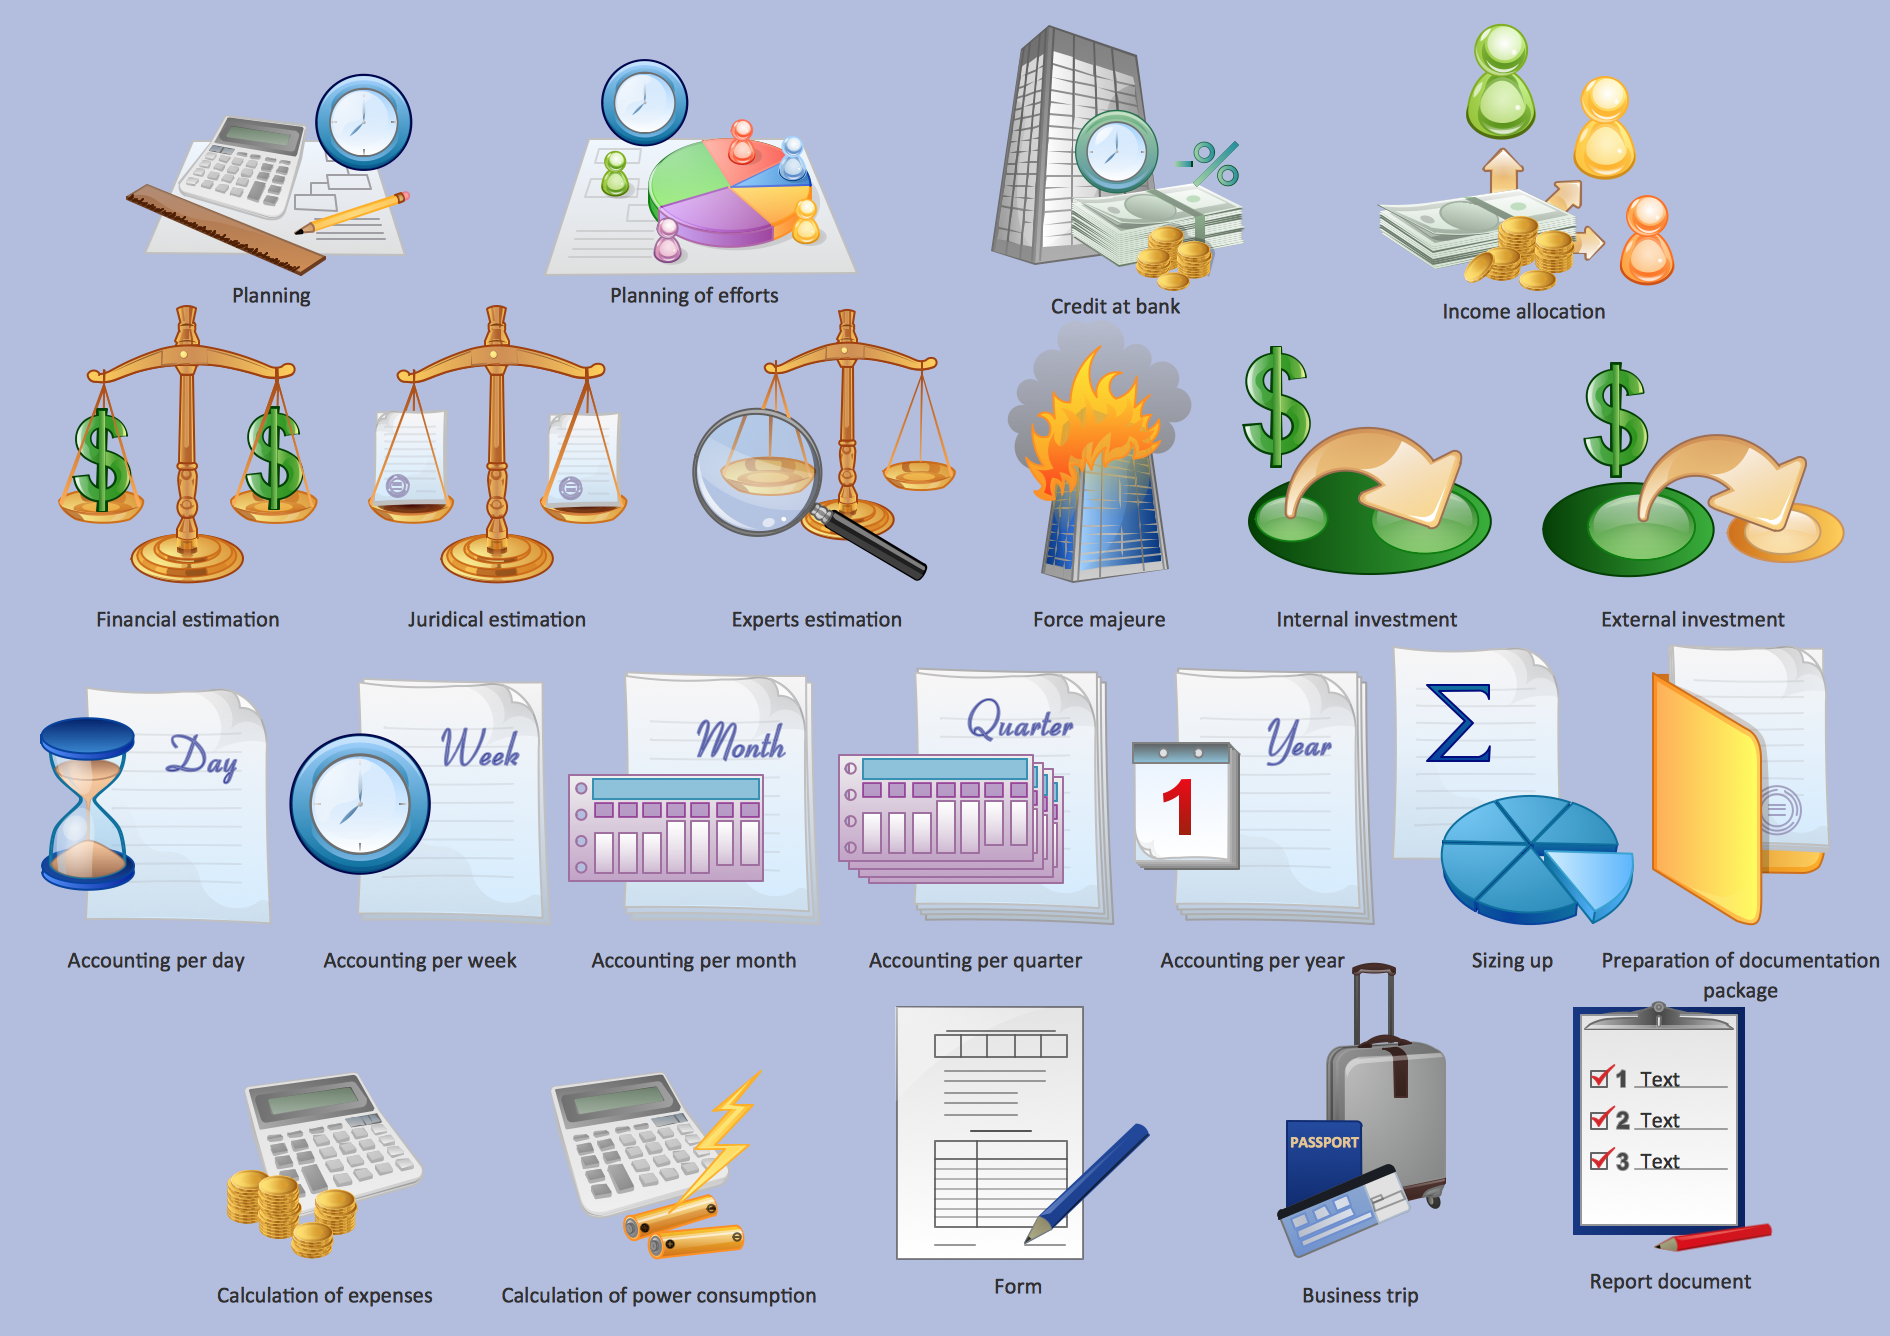
When you need to draw a professional management drawing, these management design elements, samples, templates and libraries with vector clip art for drawing the Marketing Illustrations. Conceptdraw symbols and signs you can use in your design for Strategic Management, Graphic Design, Planning implementation and more. You can create and view impact analysis drawings from specific design elements to examine the tasks.How To Create CCTV Network Diagram
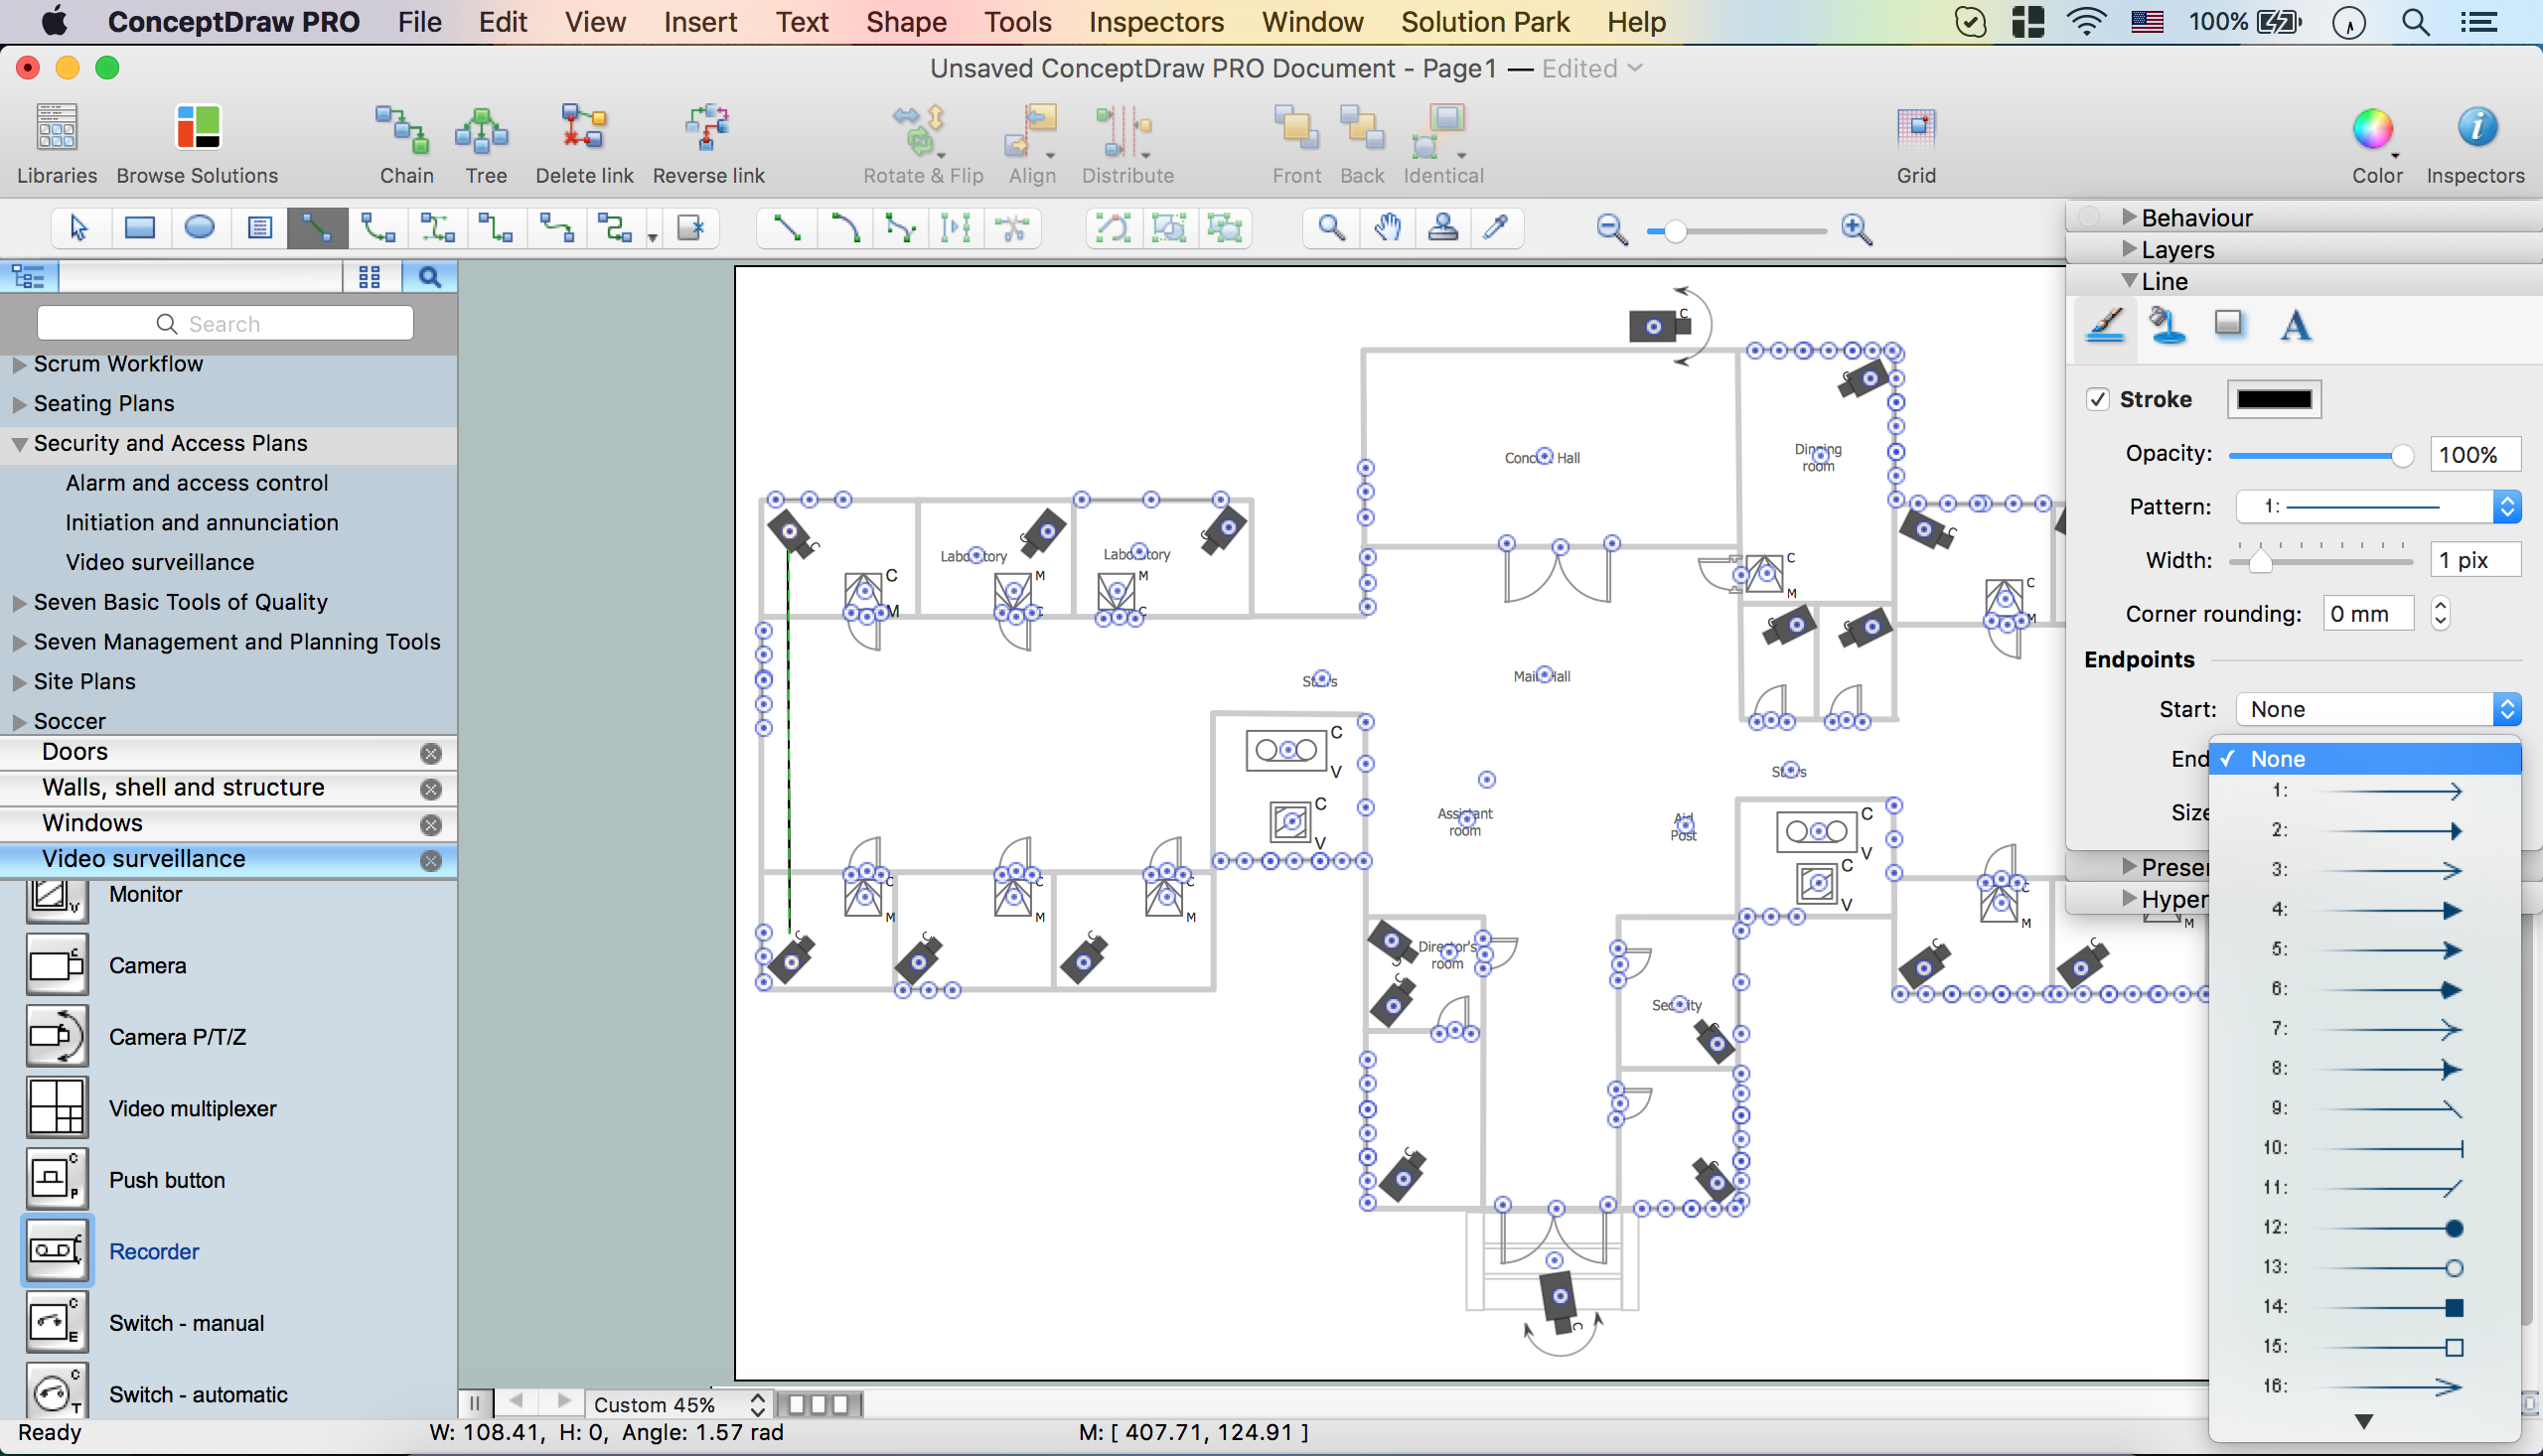
Closed-circuit television (CCTV) uses cameras and monitors to carry out video surveillance. Unlike broadcast television this system has only local signal. It is a feature of almost every video camera, yet CCTV is mainly a system for visual control of certain areas such as banks, airports, supermarkets, and other places for security reasons. Developing and installing CCTV system is a time-consuming process. It also requires certain knowledge and skills. ConceptDraw is a solution of setting video cameras rationally. You can achieve two aims at once: CCTV Design Tool saves your time and your money and helps you make professional video surveillance system.- Physics | Language Learning | Astronomy |
- Physics | Biology | Language Learning | - Conceptdraw.com
- Drawing Illustration | Drawing a Nature Scene | Water Cycle |
- Physics | Biology | Language Learning |
- Mathematics | Astronomy | Science and Education Area |
- Venn Diagram Examples for Problem Solving. Computer Science ...
- Chemistry | Design elements - Chemical elements | Carbonyl ...
- Design elements - Chemical drawings | Chemistry | Engineering |
- Venn Diagram Examples for Problem Solving. Computer Science ...
- Design elements - Biochemistry of metabolism | Biochemical ...
- Business Diagram Software | Physics | ConceptDraw Arrows10 ...
- PM Meetings | Platonic solid | Online Collaboration via Skype |
- Chemistry | Education | Carbonyl compound halogenation mechanism
- Water cycle diagram | Drawing a Nature Scene | Drawing Illustration |
- Chemistry | Metabolic pathway map - Biochemical diagram ...
- Design elements - Biochemistry of metabolism | Biochemical ...
- Data Flow Diagrams | Universal Diagramming Area | ER Diagrams ...
- Circular arrows diagram - Quality cycle | Citric acid cycle (TCA cycle ...
- Biochemical metabolic pathway map diagram | Glycolysis overview ...
- Drawing a Nature Scene | Drawing Illustration | Water Cycle |


