Basic Flowchart Symbols and Meaning


"Classic TQM Tools ...
Flow Charts Pictures, symbols or text coupled with lines, arrows on lines show direction of flow. Flowcharting enables
modeling of processes; problems/ opportunities and decision points etc. It develops a common understanding of a process by those in
volved." [whaqualitycenter.org/ Portals/ 0/ Tools%20 to%20 Use/ Classic%20 Quality%20 Tools/ Classic%20 TQM%20 Tools%20 R%20 2-12.pdf]
The vector stencils library TQM diagrams contains 58 symbols for drawing total quality management (TQM) flow charts using the ConceptDraw PRO diagramming and vector drawing software.
The example "Design elements - TQM diagram" is included in the Total Quality Management (TQM) Diagrams solution from the Quality area of ConceptDraw Solution Park.
TQM flow chart symbols

Business Process Flowchart Symbols

The vector stencils library "HR flowchart" contains 62 flowchart symbols.
Use it to draw your HR flowcharts, workflow diagrams and process charts with the ConceptDraw PRO diagramming and vector drawing software.
The flow chart symbols library "HR flowchart" is included in the HR Flowcharts solution from the Management area of ConceptDraw Solution Park.
Use it to draw your HR flowcharts, workflow diagrams and process charts with the ConceptDraw PRO diagramming and vector drawing software.
The flow chart symbols library "HR flowchart" is included in the HR Flowcharts solution from the Management area of ConceptDraw Solution Park.
Annotation

Card

Check / audit (diamond)
-hr-flowchart---vector-stencils-library.png--diagram-flowchart-example.png)
Check / audit (square)
-hr-flowchart---vector-stencils-library.png--diagram-flowchart-example.png)
Collate

Comment / note symbol (brace)
-hr-flowchart---vector-stencils-library.png--diagram-flowchart-example.png)
Communication link

Compare (diamond)
-hr-flowchart---vector-stencils-library.png--diagram-flowchart-example.png)
Compare (square)
-hr-flowchart---vector-stencils-library.png--diagram-flowchart-example.png)
Completed form

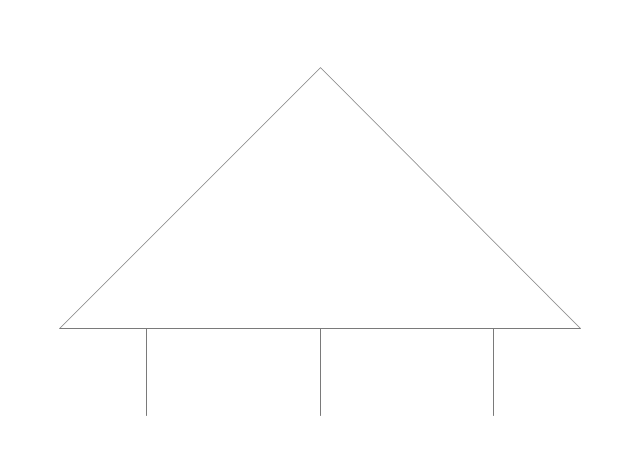
Concurrency symbol (fork / join)
-hr-flowchart---vector-stencils-library.png--diagram-flowchart-example.png)
Conditional selector

Control transfer

Data input / output

Database

Decision

Decision indicator - No

Decision indicator - Yes

Delay

Direct access storage

Disk storage

Display

Divided process (table view)
-hr-flowchart---vector-stencils-library.png--diagram-flowchart-example.png)
Document

Entity (rounded)
-hr-flowchart---vector-stencils-library.png--diagram-flowchart-example.png)
Event

Extract

Flow line

Internal storage

Junction symbol

Lined document

Lined / shaded process

Loop limit

Manual file

Manual input

Manual operation

Merge

Multi document

Multi process

Off-page reference - arrow
Off-page reference - incoming

Off-page reference - outgoing

On-page reference/ Inspection point

Or

Page

Paper tape

Predefined process

Prepare conditional

Process step

Reference point

Sequential access storage

Sort

Start (circle)
-hr-flowchart---vector-stencils-library.png--diagram-flowchart-example.png)
Start (ellipse)
-hr-flowchart---vector-stencils-library.png--diagram-flowchart-example.png)
Stickman pictogram

Stored data

Summary

Tagged document

Tagged process

Terminal point

Title block

Torso pictogram

The vector stencils library "Sales flowchart" contains 62 sales process flow chart symbols.
Use these flow chart icon set to draw your sales flowcharts, workflow diagrams and process charts with the ConceptDraw PRO diagramming and vector drawing software.
The sales process flowchart symbols library "Sales flowchart" is included in the Sales Flowcharts solution from the Marketing area of ConceptDraw Solution Park.
Annotation

Card

Check / audit (diamond)
-sales-flowchart---vector-stencils-library.png--diagram-flowchart-example.png)
Check / audit (square)
-sales-flowchart---vector-stencils-library.png--diagram-flowchart-example.png)
Collate

Comment / note symbol (brace)
-sales-flowchart---vector-stencils-library.png--diagram-flowchart-example.png)
Communication link

Compare (diamond)
-sales-flowchart---vector-stencils-library.png--diagram-flowchart-example.png)
Compare (square)
-sales-flowchart---vector-stencils-library.png--diagram-flowchart-example.png)
Completed form

Concurrency symbol (fork / join)
-sales-flowchart---vector-stencils-library.png--diagram-flowchart-example.png)
Conditional selector

Control transfer

Database

Data input / output

Decision

Decision indicator - No

Decision indicator - Yes

Delay

Direct access storage

Disk storage

Display

Divided process (table view)
-sales-flowchart---vector-stencils-library.png--diagram-flowchart-example.png)
Document

Entity (rounded)
-sales-flowchart---vector-stencils-library.png--diagram-flowchart-example.png)
Event

Extract

Flow line

Internal storage

Junction symbol

Lined document

Lined / shaded process

Loop limit

Manual file

Manual input

Manual operation

Merge

Multi document

Multi process

Off-page reference - arrow
Off-page reference - incoming

Off-page reference - outgoing

On-page reference/ Inspection point

Or

Page

Paper tape

Predefined process

Prepare conditional

Process step

Reference point

Sequential access storage

Sort

Start (circle)
-sales-flowchart---vector-stencils-library.png--diagram-flowchart-example.png)
Start (ellipse)
-sales-flowchart---vector-stencils-library.png--diagram-flowchart-example.png)
Stickman pictogram

Stored data

Summary

Tagged document

Tagged process

Terminal point

Title block

Torso pictogram

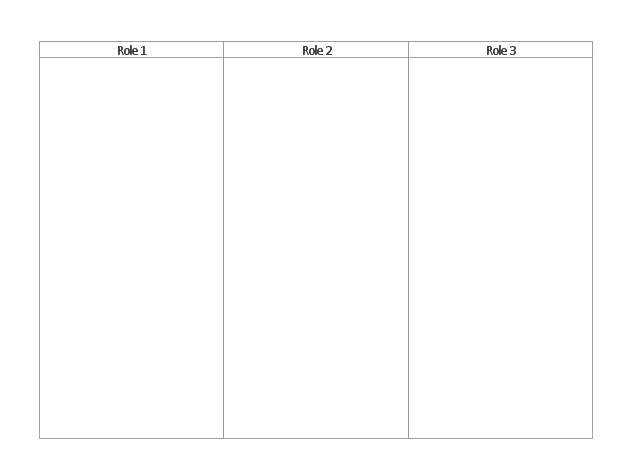
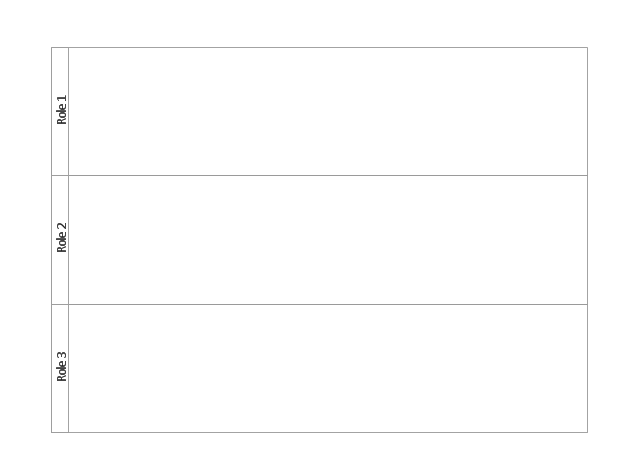
The vector stencils library "Cross-functional flowcharts" contains 31 flow chart symbols. Use it for drawing cross-functional and deployment flowcharts the ConceptDraw PRO diagramming and vector drawing software extended with the Cross-Functional Flowcharts solution from the Business Processes area of ConceptDraw Solution Park.
Swimlanes Vertical
Swimlanes Horizontal
Terminator

Process

Decision

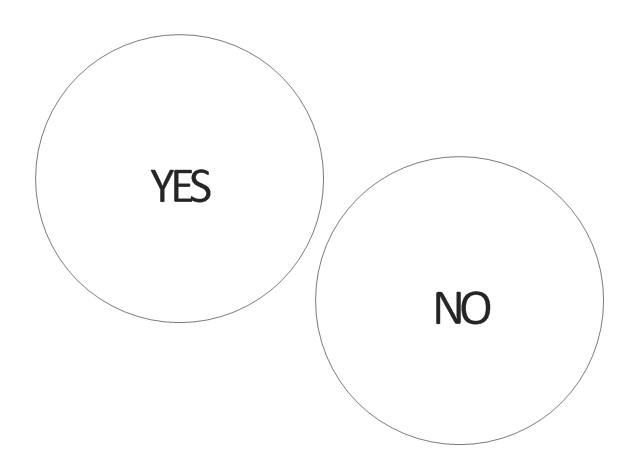
Yes
No
YES/NO
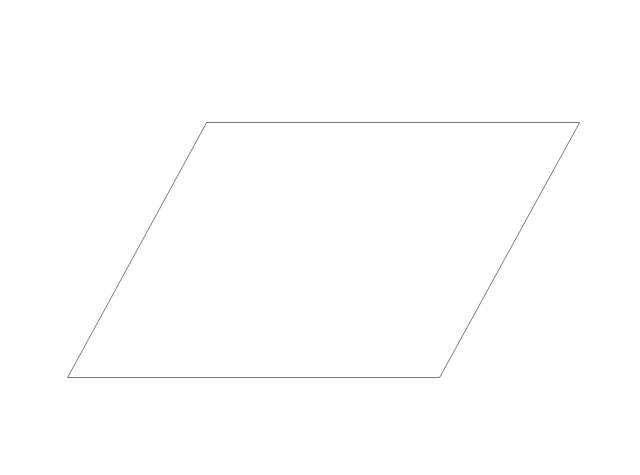
Data
Manual Operation

Document
Predefined Process

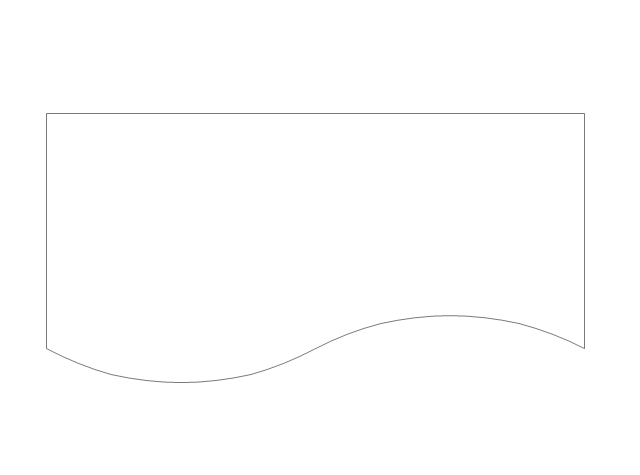
Stored Data
Internal Storage
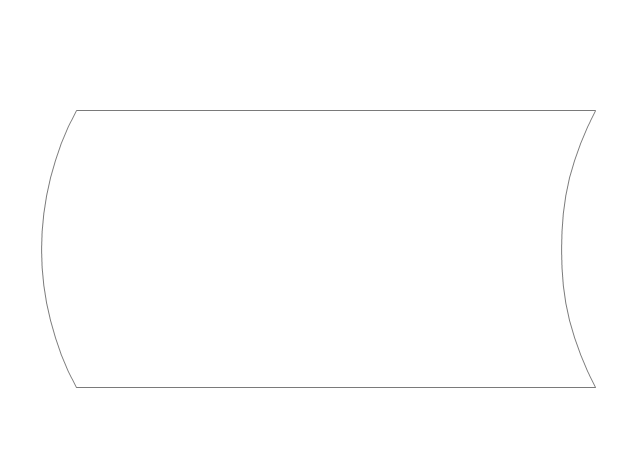
Sequential Data
Direct Data
Manual Input
Card

Paper Tape
Display
Preparation
Parallel Mode
Loop limit

On-page Reference

Off-Page Reference (Outgoing)
-cross-functional-flowcharts---vector-stencils-library.png--diagram-flowchart-example.png)
Off-Page Reference (Incoming)
-cross-functional-flowcharts---vector-stencils-library.png--diagram-flowchart-example.png)
Off-page Reference (Circle)
-cross-functional-flowcharts---vector-stencils-library.png--diagram-flowchart-example.png)
Off-Page Reference (Arrow)
-cross-functional-flowcharts---vector-stencils-library.png--diagram-flowchart-example.png)
Annotation
Control Transfer
Condition
The vector stencils library "Flowchart" contains 26 symbols for drawing flowcharts.
Use these shapes to draw your flow charts in the ConceptDraw PRO diagramming and vector drawing software extended with the Flowcharts solution from the area "What is a Diagram" of ConceptDraw Solution Park.
www.conceptdraw.com/ solution-park/ diagram-flowcharts
Use these shapes to draw your flow charts in the ConceptDraw PRO diagramming and vector drawing software extended with the Flowcharts solution from the area "What is a Diagram" of ConceptDraw Solution Park.
www.conceptdraw.com/ solution-park/ diagram-flowcharts
Terminator

Process

Decision

Delay

Subroutine

Data

Document

Multiple documents

Preparation

Display

Manual input

Manual loop

Loop limit

Connector

Off-page connector

Off-page connector

Off-page connector

Off-page connector

Or
Summing junction

Collate

Sort

Merge

Stored data

Database

Internal storage

Flowchart

Design Data Flow. DFD Library

Sales Steps

 Sales Flowcharts
The Sales Flowcharts solution lets you create and display sales process maps, sales process workflows, sales steps, the sales process, and anything else involving sales process management.
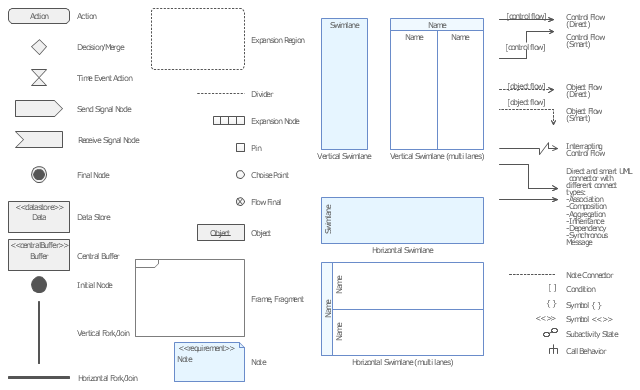
The vector stencils library "UML activity diagrams" contains 37 symbols for the ConceptDraw PRO diagramming and vector drawing software.
"Activity diagrams are constructed from a limited number of shapes, connected with arrows. The most important shape types:
(1) rounded rectangles represent actions;
(2) diamonds represent decisions;
(3) bars represent the start (split) or end (join) of concurrent activities;
(4) a black circle represents the start (initial state) of the workflow;
(5) an encircled black circle represents the end (final state).
Arrows run from the start towards the end and represent the order in which activities happen.
Hence they can be regarded as a form of flowchart. Typical flowchart techniques lack constructs for expressing concurrency. However, the join and split symbols in activity diagrams only resolve this for simple cases; the meaning of the model is not clear when they are arbitrarily combined with decisions or loops." [Activity diagram. Wikipedia]
The example "Design elements - UML activity diagrams" is included in the Rapid UML solution from the Software Development area of ConceptDraw Solution Park.
UML activity diagram symbols
Process Flow Chart

Flow Map

Process Flow Maps

- Basic Flowchart Symbols and Meaning | Flowchart | Flowchart ...
- Basic Flowchart Symbols and Meaning | Flowchart | Sales Steps ...
- Basic Flowchart Symbols and Meaning | Flowchart | Sales Steps ...
- Basic Flowchart Symbols and Meaning | Activities BPMN 1.2 - Vector ...
- Basic Flowchart Symbols and Meaning | Cross-functional flowcharts ...
- Basic Flowchart Symbols and Meaning | Design elements - TQM ...
- Database Flowchart Symbols | Basic Flowchart Symbols and ...
- Basic Flowchart Symbols and Meaning | Yourdon and Coad ...
- Basic Flowchart Symbols and Meaning | TQM diagrams - Vector ...
- Flowchart - Vector stencils library
- Quality Control Chart Software — ISO Flowcharting | Design ...
- Basic Flowchart Symbols and Meaning | HR flowchart - Vector ...
- Basic Flowchart Symbols and Meaning | Design elements - Activities ...
- Basic Flowchart Symbols and Meaning | How to Draw a Flowchart ...
- Flowchart Contains 26 Symbols For Drawing Flowcharts
- Basic Flowchart Symbols and Meaning | Flowchart | Processing ...
- Basic Flowchart Symbols and Meaning | Flowchart design ...
- Basic Flowchart Symbols and Meaning | Business Process ...
- Basic Flowchart Symbols and Meaning | Process Flowchart | Flow ...
- Function Flow Chart