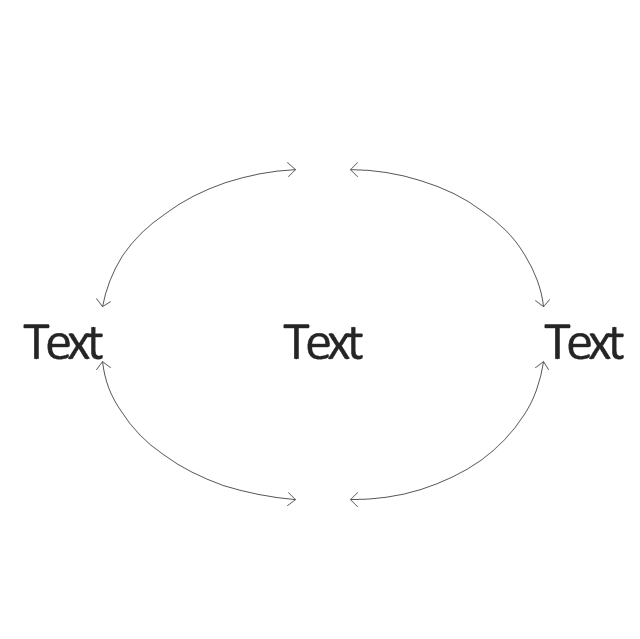
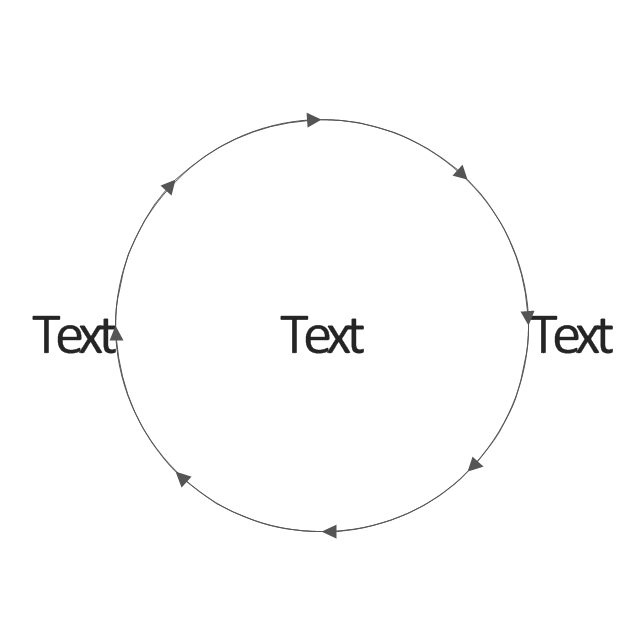
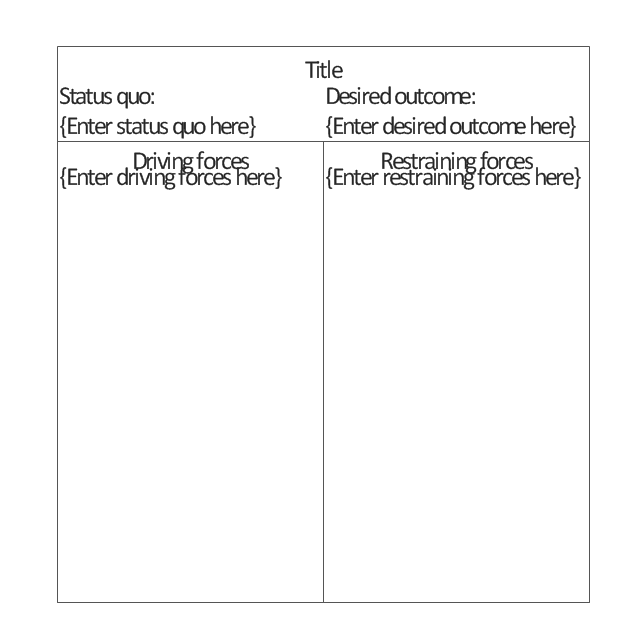
The vector stencils library "TQM diagrams" contains 58 TQM symbols. Use it in business process re-engineering, total quality management, continuous improvement, and quality solutions to draw cause-and-effect diagrams, top-down, and cross-functional process flow charts in the ConceptDraw PRO diagramming and vector drawing software extended with the Total Quality Management (TQM) Diagrams solution from the Quality area of ConceptDraw Solution Park.
The vector stencils library "TQM diagrams" contains 58 TQM symbols. Use it in business process re-engineering, total quality management, continuous improvement, and quality solutions to draw cause-and-effect diagrams, top-down, and cross-functional process flow charts in the ConceptDraw PRO diagramming and vector drawing software extended with the Total Quality Management (TQM) Diagrams solution from the Quality area of ConceptDraw Solution Park.
Types of Flowcharts
A Flowchart is a graphical representation of process, algorithm, workflow or step-by-step solution of the problem. It shows the steps as boxes of various kinds and connects them by arrows in a defined order depicting a flow. There are twelve main Flowchart types: Basic Flowchart, Business Process Modeling Diagram (BPMN), Cross Functional Flowchart, Data Flow Diagram (DFD), IDEF (Integrated DEFinition) Flowchart, Event-driven Process Chain (EPC) Diagram, Influence Diagram (ID), Swimlane Flowchart, Process Flow Diagram (PFD), Specification and Description Language (SDL) Diagram, Value Stream Mapping, Workflow Diagram. Using the Flowcharts solution from the Diagrams area of ConceptDraw Solution Park you can easy and quickly design a Flowchart of any of these types. This solution offers a lot of special predesigned vector symbols for each of these widely used notations. They will make the drawing process of Flowcharts much easier than ever. Pay also attention for the included collection of ready Flowchart examples, samples and quick-start templates. This is business process improvement tools. If you are looking for MS Visio for your Mac, then you are out of luck, because it hasn't been released yet. However, you can use Visio alternatives that can successfully replace its functions. ConceptDraw PRO is an alternative to MS Visio for Mac that provides powerful features and intuitive user interface for the same.
IDEF0 Flowchart Symbols
The modeling of business and business processes is not quite a simple process for both small-size businesses and large businesses. The IDEF0 method is one of the popular and easy methods of modeling the business as a complex system. It is based on the functional modeling language Structured Analysis and Design Technique (abbr. SADT) and is concentrated on the activity modeling. According to this method are constructed the IDEF0 Diagrams and IDEF0 Flowcharts, which are succesfully used not only for documenting the business, but also for analysis, development, integration of information and software systems, reengineering, etc. This method suggests the use of special IDEF0 Flowchart Symbols from the IDEF0 notation for construction the IDEF0 Flowcharts. ConceptDraw PRO diagramming and vector graphic software extended with IDEF0 Diagrams solution from the Software Development area of ConceptDraw Solution Park is rich for the powerful drawing tools, built-in templates and samples, and predesigned IDEF0 flowchart symbols.
 Marketing Diagrams
Marketing Diagrams solution extends ConceptDraw PRO diagramming software with abundance of samples, templates and vector design elements intended for easy graphical visualization and drawing different types of Marketing diagrams and graphs, including Branding Strategies Diagram, Five Forces Model Diagram, Decision Tree Diagram, Puzzle Diagram, Step Diagram, Process Chart, Strategy Map, Funnel Diagram, Value Chain Diagram, Ladder of Customer Loyalty Diagram, Leaky Bucket Diagram, Promotional Mix Diagram, Service-Goods Continuum Diagram, Six Markets Model Diagram, Sources of Customer Satisfaction Diagram, etc. Analyze effectively the marketing activity of your company and apply the optimal marketing methods with ConceptDraw PRO software.
IDEF
IDEF Business Process Diagrams solution from the Business Processes area of ConceptDraw Solution Park extends ConceptDraw PRO vector graphics and diagramming software with the ability of fast and easy drawing various types of IDEF diagrams.Integration Definition
Creation of various types of Integration DEFinition (IDEF) diagrams - IDEF0, IDEF1X, IDEF2, IDEF3 and many other is a sufficiently complex process that requires powerful automated tools. ConceptDraw PRO diagramming and vector drawing software offers you such tool - IDEF Business Process Diagrams solution from the Business Processes area of ConceptDraw Solution Park.
 Marketing Area
The solutions from Marketing area of ConceptDraw Solution Park collect templates, samples and libraries of vector stencils for drawing the marketing diagrams and mind maps.
 Target and Circular Diagrams
This solution extends ConceptDraw PRO software with samples, templates and library of design elements for drawing the Target and Circular Diagrams.
 Computer and Networks Area
The solutions from Computer and Networks Area of ConceptDraw Solution Park collect samples, templates and vector stencils libraries for drawing computer and network diagrams, schemes and technical drawings.
 25 Typical Orgcharts
The 25 Typical Orgcharts solution contains powerful organizational structure and organizational management drawing tools, a variety of professionally designed organization chart and matrix organization structure samples, 25 templates based on various orga
- Cause Effect Diagrams Tqm
- TQM diagrams - Vector stencils library | Business diagrams & Org ...
- Basic Flowchart Symbols and Meaning | TQM diagrams - Vector ...
- Organizational Structure Total Quality Management | Why do you ...
- UML timing diagram - Inspection | UML object diagram - Safety ...
- TQM diagrams - Vector stencils library
- Technical drawing - Machine parts assembling
- Data Flow Diagrams (DFD) | Acid sulfate soil adaptive management ...
- TQM diagrams - Vector stencils library | The Fifty Two Elements of ...
- Total Quality Management TQM Diagrams | How to Create a TQM ...
- Process annotations - Vector stencils library | Audit flowcharts ...
- Result Analysis Diagram Service Industry
- Block diagram - Porter's five forces model | Target diagrams - Vector ...
- Swot Analysis Examples | Sales KPIs
- BPR Diagram. Business Process Reengineering Example | SWOT ...
- Aerospace and Transport | Aerospace - Design Elements ...
- Stakeholder Onion Diagrams | Visualize Stakeholder Analysis ...
- SWOT Analysis Solution - Strategy Tools | Ice Hockey Diagram ...
- Marketing Charts | Design elements - Marketing charts | Market ...
- Ice Hockey Diagram – Defensive Strategy – Neutral Zone Trap ...









-tqm-diagrams---vector-stencils-library.png--diagram-flowchart-example.png)
-tqm-diagrams---vector-stencils-library.png--diagram-flowchart-example.png)
-tqm-diagrams---vector-stencils-library.png--diagram-flowchart-example.png)
-tqm-diagrams---vector-stencils-library.png--diagram-flowchart-example.png)








-tqm-diagrams---vector-stencils-library.png--diagram-flowchart-example.png)


-tqm-diagrams---vector-stencils-library.png--diagram-flowchart-example.png)
-tqm-diagrams---vector-stencils-library.png--diagram-flowchart-example.png)
-tqm-diagrams---vector-stencils-library.png--diagram-flowchart-example.png)
-tqm-diagrams---vector-stencils-library.png--diagram-flowchart-example.png)
-tqm-diagrams---vector-stencils-library.png--diagram-flowchart-example.png)
-tqm-diagrams---vector-stencils-library.png--diagram-flowchart-example.png)
-tqm-diagrams---vector-stencils-library.png--diagram-flowchart-example.png)
-tqm-diagrams---vector-stencils-library.png--diagram-flowchart-example.png)
-tqm-diagrams---vector-stencils-library.png--diagram-flowchart-example.png)
-tqm-diagrams---vector-stencils-library.png--diagram-flowchart-example.png)
-tqm-diagrams---vector-stencils-library.png--diagram-flowchart-example.png)
-tqm-diagrams---vector-stencils-library.png--diagram-flowchart-example.png)
-tqm-diagrams---vector-stencils-library.png--diagram-flowchart-example.png)
