 ConceptDraw Solution Park
ConceptDraw Solution Park collects graphic extensions, examples and learning materials
HelpDesk
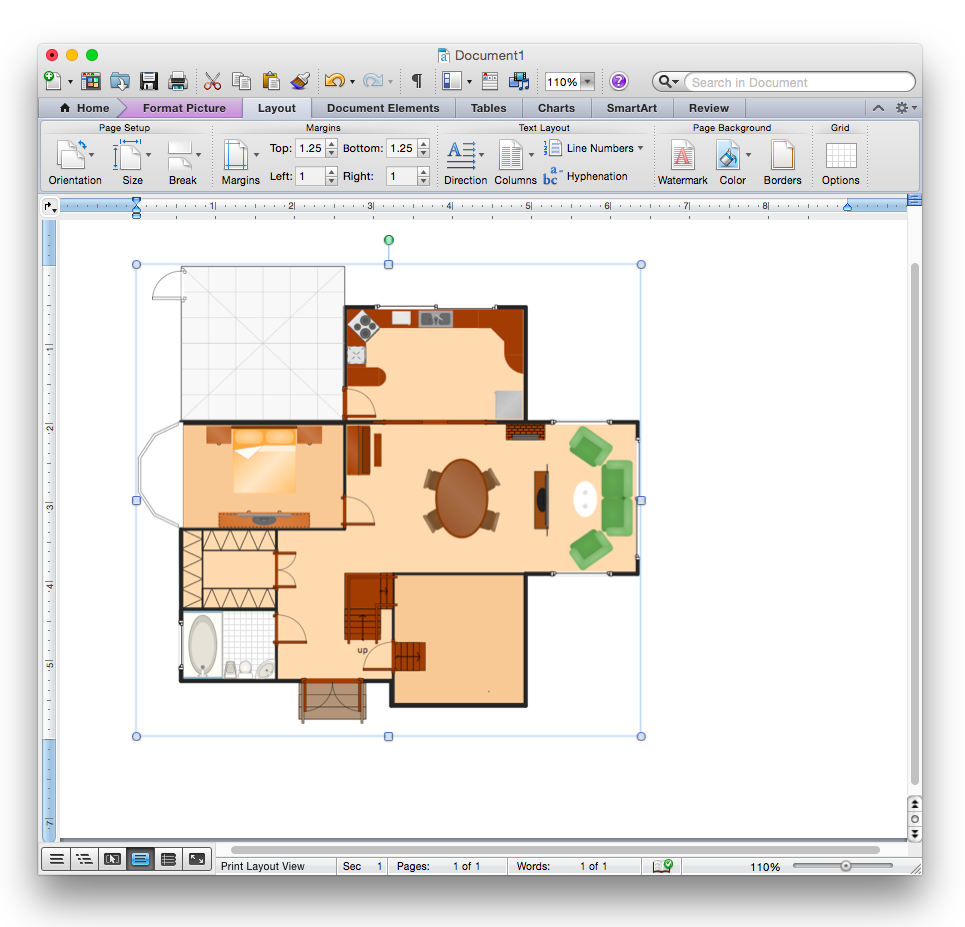
How to Add a Floor Plan to a MS Word Document Using ConceptDraw PRO
ConceptDraw PRO allows you to easily create floor plans of any complexity and then insert them into a MS Word document.HelpDesk
How to Create a Venn Diagram in ConceptDraw PRO
Venn diagrams were invented by John Venn as a method of depicting relationships between different components. A Venn diagram consists of two or more circles. Each circle represents a specific group or set. The entities which are depicted by circles generally have some common characteristics. A Venn Diagram shows all the possible logical relations between these entities. Any properties that belong to more than one set should be indicated in the sections where the circles overlap. A Venn Diagram can be useful to visually summarize the status and future viability of a project. ConceptDraw PRO allows you to make a Venn diagrams using the Venn Diagrams solution.HelpDesk
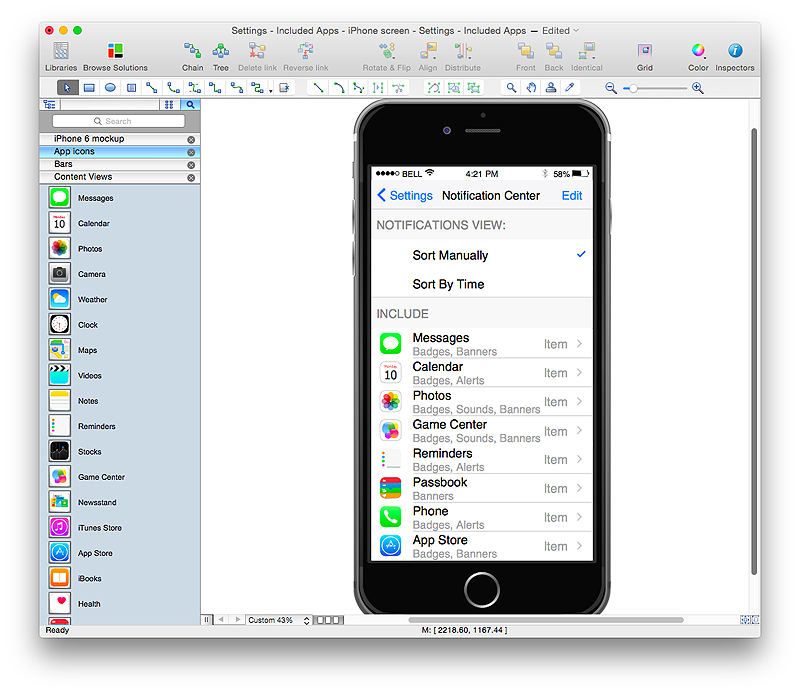
How to Design an Interface Mockup for iPhone Application in ConceptDraw PRO
The Apple iPhone user interface has become something of a standard for smartphones, and mobile devices in general. A well designed user interface (UI) is very important for user-friendly navigation and best correlation with operating system logic. Development of successful iPhone App UI requires a planning and prototyping stage. An iPhone UI diagram can be employed to give a general view of the device's screen, upon which elements can be placed and re-arranged as necessary. Using ConceptDraw PRO you can mock-up an iPhone UI system so that you can figure out how best to represent user interface (UI) elements for the development of a new iPhone App.HelpDesk
How to Create a Fishbone (Ishikawa) Diagram Quickly
A Fishbone (Ishikawa) diagram is also called cause-and-effect diagram. Fishbone diagram is often used in business to determine the cause of some problem. The diagram illustrates the main causes and sub-causes leading to an event. The main goal of the Fishbone diagram is to illustrate in a graphical way the relationship between a given outcome and all the factors that influence this outcome. The complete diagram resembles a fish skeleton as its name implies. The ability to create a Fishbone Diagram is supported by the Fishbone Diagram solution. Use ConceptDraw MINDMAP for structuring data and then ConceptDraw PRO for generating a Fishbone Diagram from mind map structure.HelpDesk
How to Draw a Fishbone Diagram with ConceptDraw PRO
Fishbone (Ishikawa) Diagram is often used in business to determine the cause of some problem. A Fishbone diagram is also called cause-and-effect diagram.The main goal of the Fishbone diagram is to illustrate in a graphical way the relationship between a given outcome and all the factors that influence this outcome. The complete diagram resembles a fish skeleton as its name implies. Cause and Effect analysis is used in management to identify the possible causes of a problem in order to eliminate them. The ability to create a Fishbone Diagram is supported by the Fishbone Diagram solution.HelpDesk
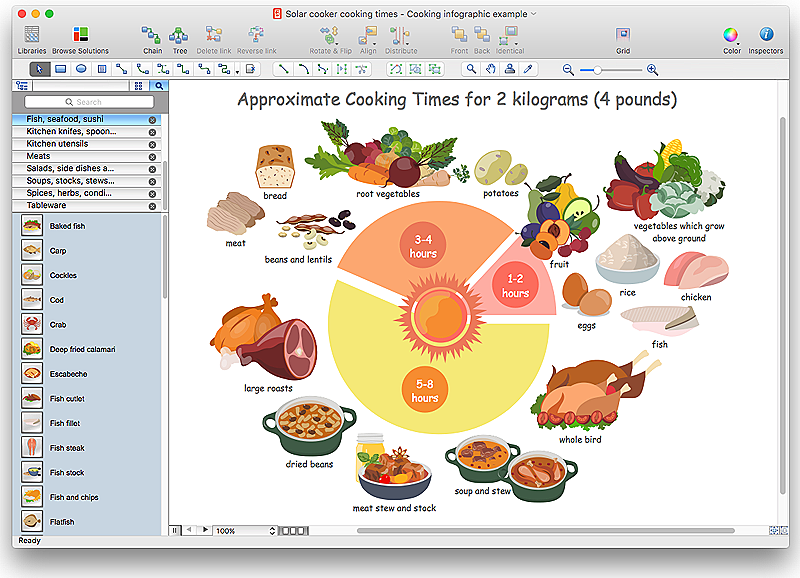
How to Design a Food-related Infographics Using ConceptDraw PRO
Today a large piece of business is referred to a food. This business can not be imagined without various kinds of visualizations. You can see them everywhere — on brand logos, in advertising, on menus and in flyers. Also different food related infographics is used to promote healthy nutrition and to deliver information on how to maintain an effective diet. ConceptDraw Cooking Recipes solution, offers a great collection of bright food-related images and icons, placed into themed libraries. It can be used for catering menu graphics, on marketing flyers, or as concomitant text for infographics.HelpDesk
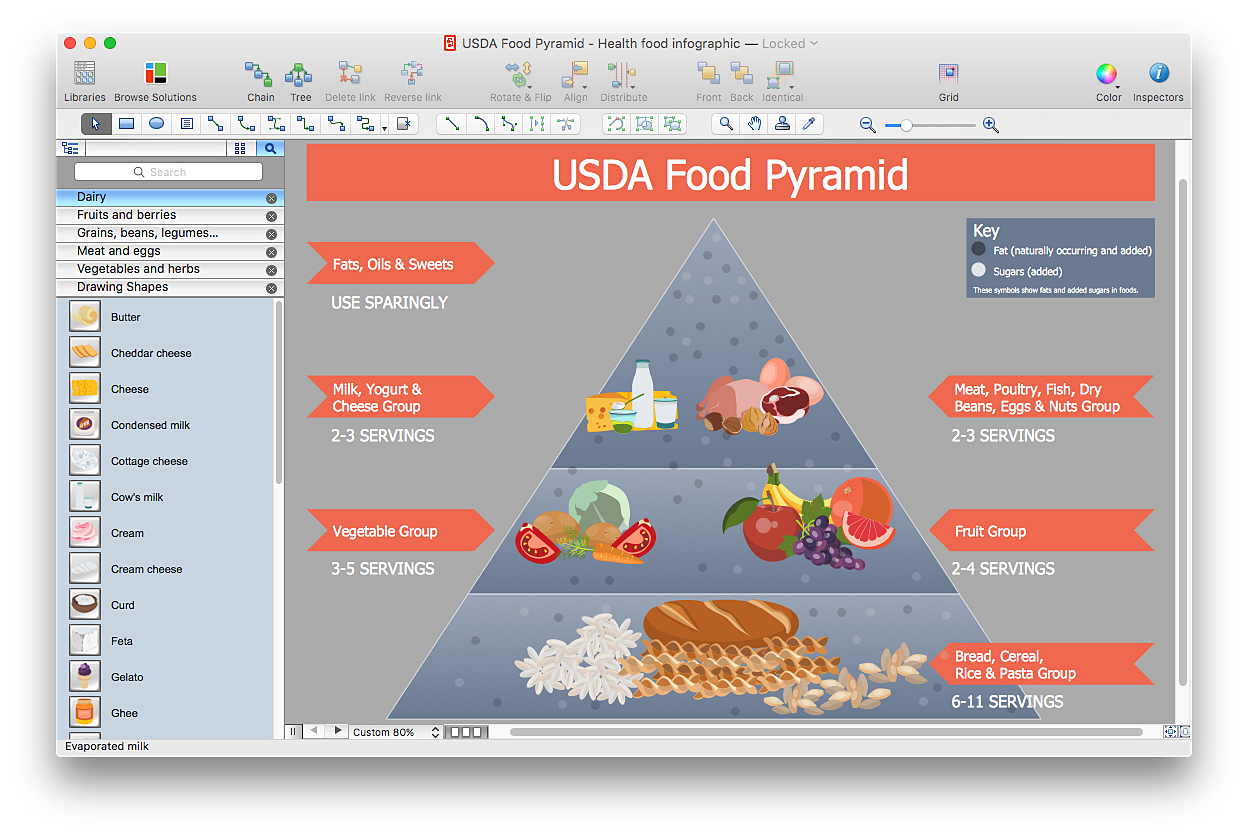
How to Create Infographics that Help People Eat Healthy
The most effective manner of presenting information on healthy diet and food nutrition is using various visualizations such as charts or infographics. To help easily create infographics and diagrams of healthy eating, ConceptDraw has provided the Health Food solution to its Solution Park. It contains vector stencil libraries of healthy eating options, samples of diagrams and infographics, and a set of templates to help you create your own diagrams, infographics and even adds. Using ConceptDraw PRO you can easily create and share healthy food recipes and materials about the proper nutrition.
 Fishbone Diagram
Fishbone Diagrams solution extends ConceptDraw PRO software with templates, samples and library of vector stencils for drawing the Ishikawa diagrams for cause and effect analysis.
- Sales Process Flowchart. Flowchart Examples | Sales Process Steps ...
- Sales Flowcharts | Sales Process Steps | Sales Process | Visio Sales ...
- Flowchart Marketing Process. Flowchart Examples | Sales Process ...
- Sales Process Flowchart. Flowchart Examples | Sales Process ...
- Sales Process Flowchart. Flowchart Examples | Sales Process | The ...
- Sales Dashboard | Sales Process Flowchart. Flowchart Examples ...
- Sales Process Flowchart. Flowchart Examples | Sales Flowcharts ...
- Sales Process Flowchart. Flowchart Examples | Sales Process Steps ...
- Sales Process Flowchart. Flowchart Examples | Marketing and Sales ...
- Sales Process Flowchart. Flowchart Examples | The Sales Process ...
- Sales Process Flow Chart Template
- Sales Process Flowchart. Flowchart Examples | UML composite ...
- Sales Process Map | Sales Process Flowchart. Flowchart Examples ...
- Sales Process Steps | Sales Process Flowchart. Flowchart Examples ...
- Sales Process Flowchart. Flowchart Examples | Sales Flowcharts ...
- Sales Process Steps | Sales Steps | Sales Process Flowchart ...
- Sales Process Management | Sales Process Map | Sales Process ...
- Sales Process Flowchart. Flowchart Examples | Work Order Process ...
- Sales Process Flowchart. Flowchart Examples | Sales Process ...


