HelpDesk
How to Create Education Infographics
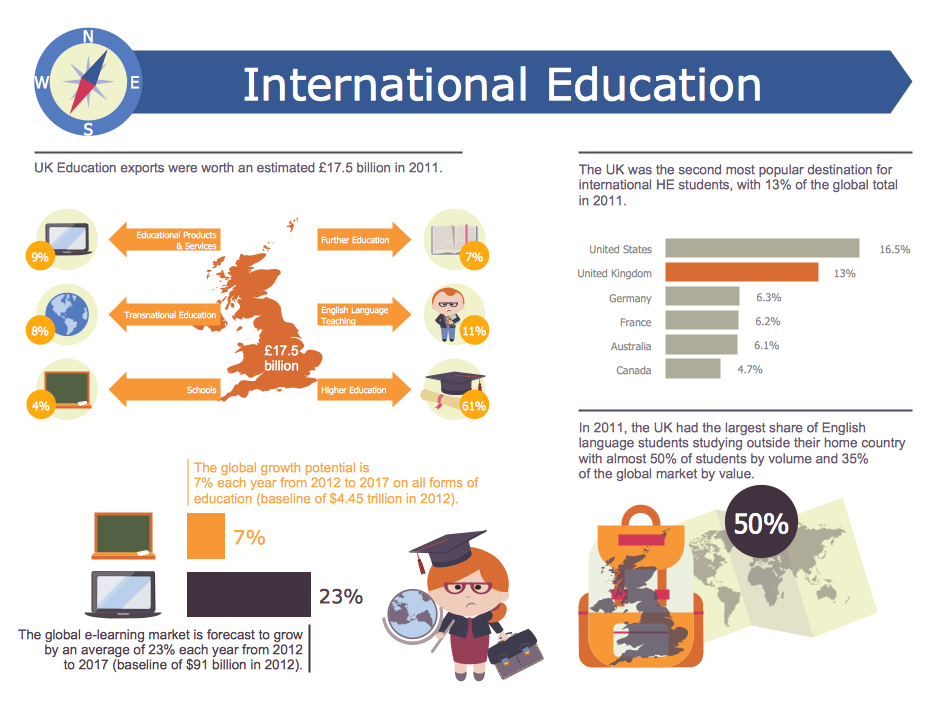
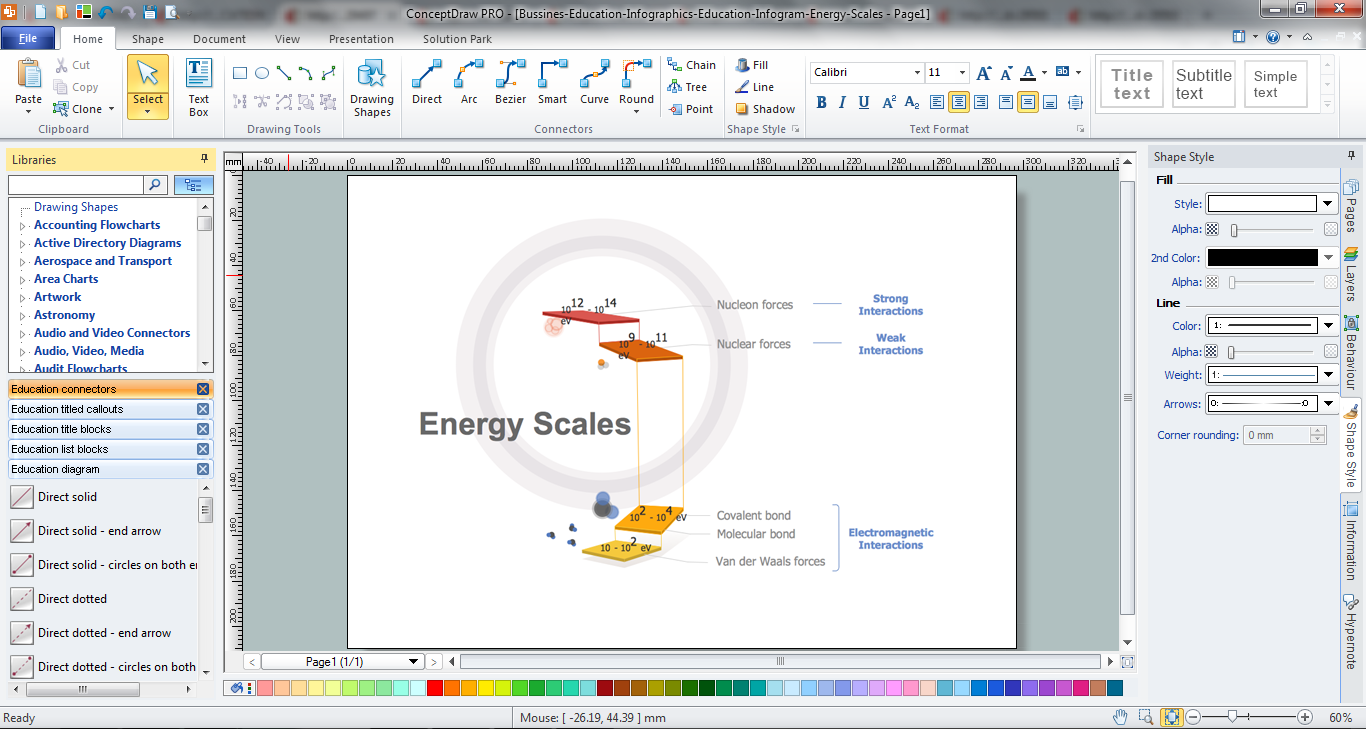
Education Infographics is used to display a lot of education-related information in a single, visually-appealing graphic. Infographics, created for education purposes can contain different illustrations, detailed charts, and data. ConceptDraw PRO can be used as a tool for creating education infographics. It allows you to draw infographics quickly and easily using the special templates and vector stencils libraries. Infographics can be used to quickly communicate a message, to simplify the presentation of large amounts of data, to see data patterns and relationships, and to monitor changes in variables over time. It can contain bar graphs, pie charts, histograms, line charts, e.t.c.Make an Infographic
You want to make an infographic and need the useful and convenient drawing tools for this? In this case the ConceptDraw PRO software extended with Education Infographics Solution is a real godsend for you.How to Make an Infographic
How to Make an Infographic quick and easy? The perfect way is to use the ConceptDraw PRO diagramming and vector drawing software extended with Education Infographics Solution from the Business Infographics Area.Education Infographics
The Education Infographics are popular and effectively applied in the educational process. Now you don't need to be an artist to design colorful pictorial education infographics thanks to the unique drawing tools of Education Infographics Solution for ConceptDraw PRO diagramming and vector drawing software.Educational Technology Tools
What are the favorite educational technology tools and techniques for teachers? Of course these are pictures, images and education infographics! ConceptDraw PRO software supplied with Education Infographics Solution from the Business Infographics Area provides powerful drawing tools to help design the education infographics of any complexity.Education Information
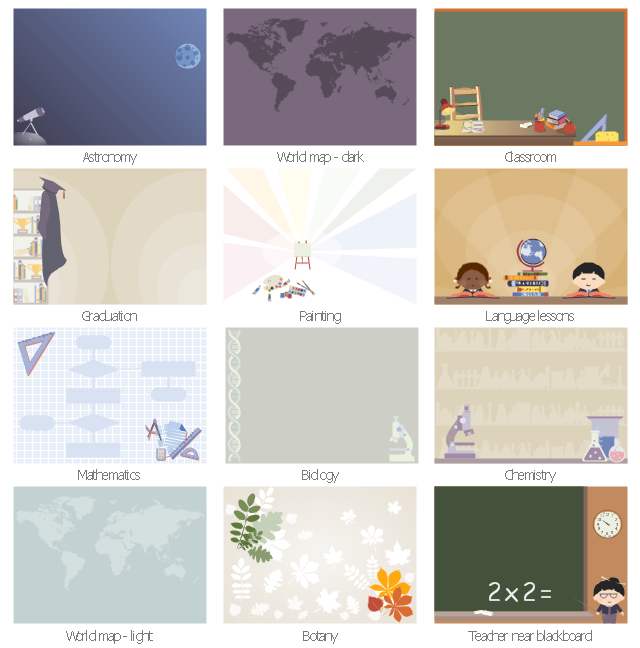
The Education Information is multifariuos and can be often represented in various forms. Еру the most successful ways of presentation the information and data are various illustrations, diagrams and colorful education infographics which you can easily make in ConceptDraw PRO software extended with Education Infographics Solution from the Business Infographics Area.The vector stencils library "Education backgrounds" contains 12 infographic backgrounds or wallpapers for creating education infograms.
"A wallpaper or background (also known as a desktop wallpaper, desktop background, desktop picture or desktop image on computers) is a digital image (photo, drawing etc.) used as a decorative background of a graphical user interface on the screen of a computer, mobile communications device or other electronic device." [Wallpaper (computing). Wikipedia]
The wallpaper example "Design elements - Education backgrounds" was created using the ConceptDraw PRO diagramming and vector drawing software extended with the Education Infographics solition from the area "Business Infographics" in ConceptDraw Solution Park.
How to Create a Powerful Infographic When You do not Have a Designer
Create a powerful infographic, become inspired by the people with ConceptDraw.
 Business Infographics Area
ConceptDraw Business Infographics Solutions helps you to design eye-catching marketing infographics, on subjects such as content marketing, education, IT, social media marketing, and marketing plans; allowing you to represent, share and explain various pi
 ConceptDraw Solution Park
ConceptDraw Solution Park collects graphic extensions, examples and learning materials
Infographic Maker
Infographic is a visual way of representing various information, data, knowledge in statistics, geography, journalism, education, and much more areas. ConceptDraw PRO supplied with Pictorial Infographics Solution from the “What are Infographics” Area, provides a set of powerful pictorial infographics tools. Thanks to them it is the best Infographic Maker.HelpDesk
How to Create Management Infographics Using ConceptDraw PRO
Management might want to communicate a basic workflow for each division of the company, visualise business strategy and decision processes, or display a certain business training concept. In this case, an infographic can be more text heavy, and use illustrations to establish a timeline, process, or step-by-step sequence of events.ConceptDraw PRO can be used as a tool for creating management infographics. It allows you to draw infographics quickly and easily using the special templates and vector stencils libraries. Infographics can be used to quickly communicate a message, to simplify the presentation of large amounts of data, to see data patterns and relationships, and to monitor changes in variables over time. It can contain bar graphs, pie charts, histograms, line charts, e.t.c.
- Education | Educational Materials | Make an Infographic ...
- How to Create Education Infographics | ConceptDraw Solution Park ...
- Education Infographics | Educational Technology Tools ...
- Educational Materials | Make an Infographic | Education Infographics
- Education | How to Create Education Infographics | Organizational ...
- Education Infographics | Language Learning | ConceptDraw ...
- Basic Flowchart Symbols and Meaning | Marketing Plan Infographic ...
- How to Create Education Infographics | How to Make an Infographic ...
- Education pictograms - Vector stencils library | Make an Infographic ...
- Physics | Education | Nuclear Physics Infographic
- Educational Technology Tools | Education Information | Biology ...
- Concept maps with ConceptDraw PRO | Education | What is ...
- Educational Technology Tools | Biology Illustration | Physics ...
- ConceptDraw Solution Park | Education Infographics | Design ...
- Sample Pictorial Chart. Sample Infographics | Design Pictorial ...
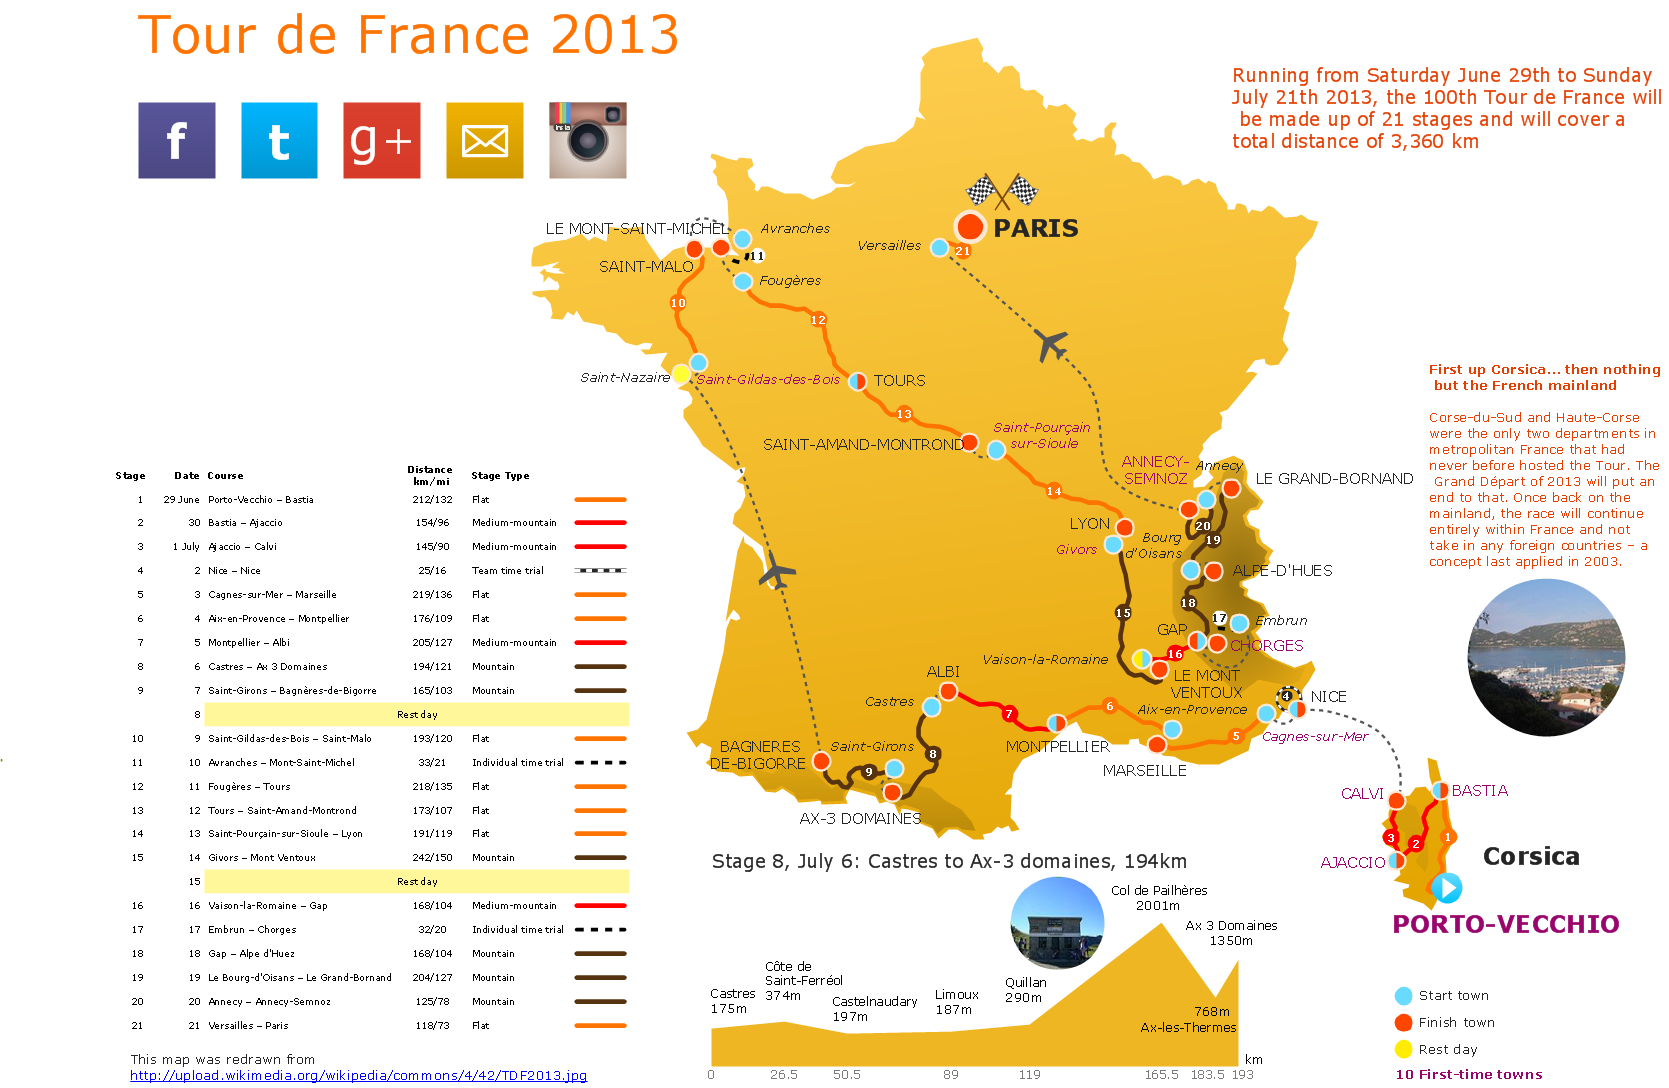
- Map Infographic Creator | Best Tool for Infographic Construction ...
- Information Graphic | Educational Materials | ConceptDraw Solution ...
- Design Pictorial Infographics . Design Infographics | Sample Pictorial ...
- Spatial infographics Design Elements: Continental Map | Design ...


