HelpDesk
Event-driven Process Chain (EPC) Diagram Software
An EPC diagram is a type of flowchart used in business process analysis. It shows different business processes through various work flows. The workflows are shown as processes and events that are related to different executes and tasks that allow business workflow to be completed. An EPC diagram shows different business processes through various workflows. The workflows are seen as functions and events that are connected by different teams or people, as well as tasks that allow business processes to be executed. The best thing about this type of enterprise modelling is that creating an EPC diagram is quick and simple as long as you have the proper tool. One of the main usages of the EPC diagrams is in the modelling, analyzing and re-engineering of business processes. With the use of the flowchart, businesses are able to see inefficiencies in the processes and modify to make them more productive. Event-driven process chain diagrams are also used to configure an enterprise resource plaHelpDesk
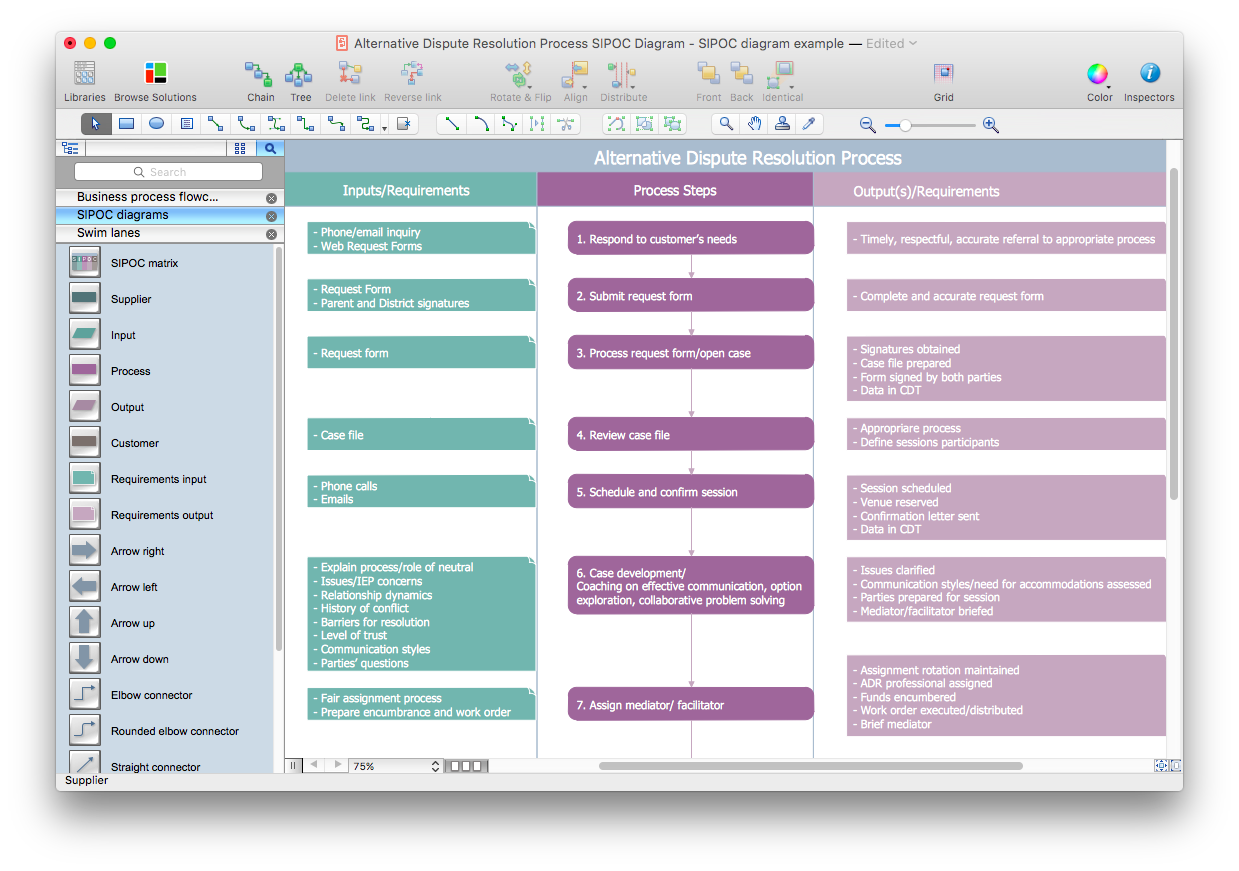
How to Create a SIPOC Diagram Using ConceptDraw PRO
SIPOC (suppliers, inputs, process, outputs, customers) diagram is focused on the quality of a business process inputs and outputs. SIPOC diagram has a form of a segmented table that gives comprehensive outline for each category. SIPOC diagram depicts the start and end of a process, and the relationships between a company and its suppliers. SIPOC diagram is an important part of the Six Sigma methodology. With its Business Process Mapping solution, ConceptDraw PRO offers a power set of process mapping tools to empower quality management within an organization.HelpDesk
How to Create a Fault Tree Analysis Diagram (FTD) in ConceptDraw PRO
Fault Tree Diagram are logic diagram that shows the state of an entire system in a relationship of the conditions of its elements. Fault Tree Diagram are used to analyze the probability of functional system failures and safety accidents. ConceptDraw PRO allows you to create professional Fault Tree Diagrams using the basic FTD symbols. An FTD visualize a model of the processes within a system that can lead to the unlikely event. A fault tree diagrams are created using standard logic symbols . The basic elements in a fault tree diagram are gates and events.- Input Output Process Diagram
- Draw The Input Output Process Diagram
- Input Output Operation In Os Flowchart
- Business Input And Output Diagram
- Supplier Input Process Output Customer
- Input Output Diagram Example
- The Function Of The Input Output Symbol
- Input Process Output Diagram Example
- Drwa Input Output Process Diagram Mgt
- Input And Output Process Diagram
- Output Processing Block Diagram
- Darw The Input Output Process Diagram
- Example Of Flowchart That Has Input Process Output And Discussion
- Examples Of Input Output Box In Flowchart
- Business Flow Diagram Input Business Process Out Put
- Input Output Process Flow Chart
- Draw The Input Output Process Diagram In An Organisation
- Fishbone diagram - Causes of low-quality output | Event-driven ...
- Example Input And Output Flowchart


