Sales KPI Dashboards
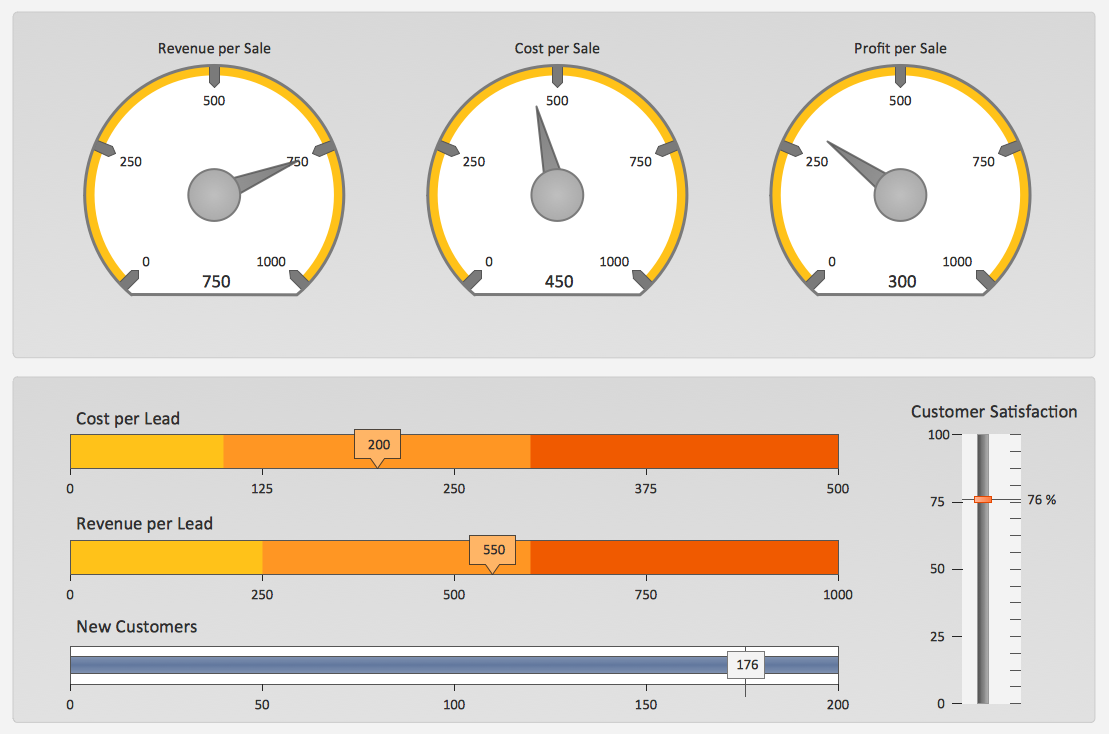
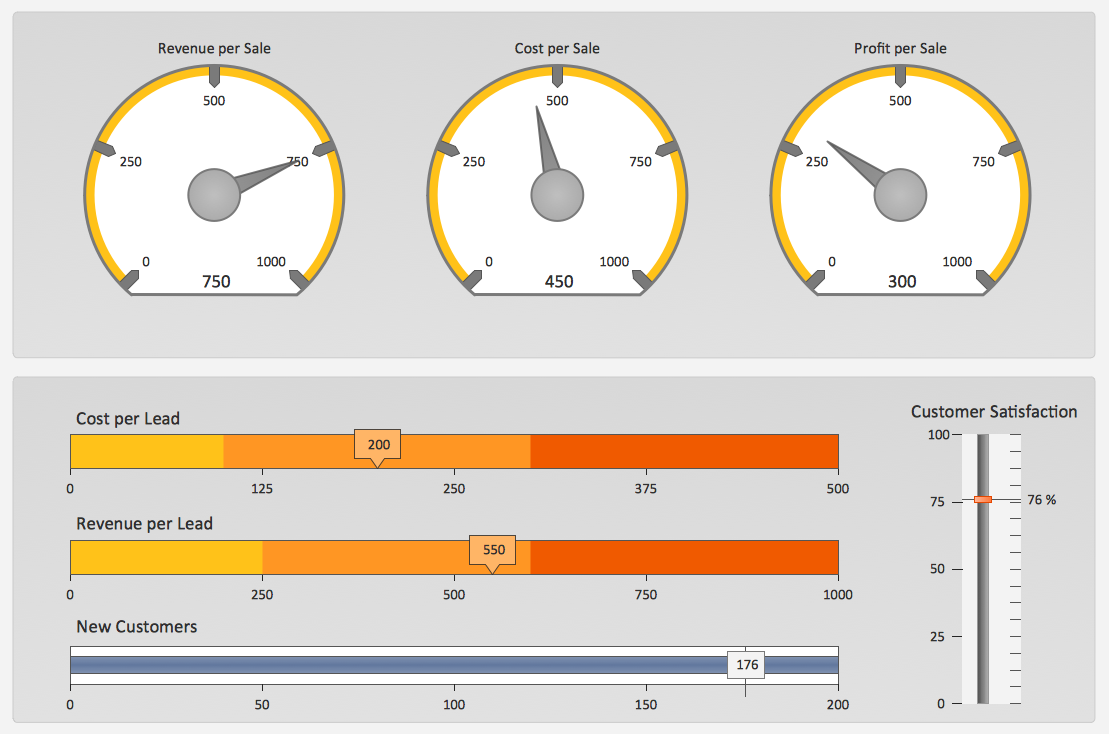
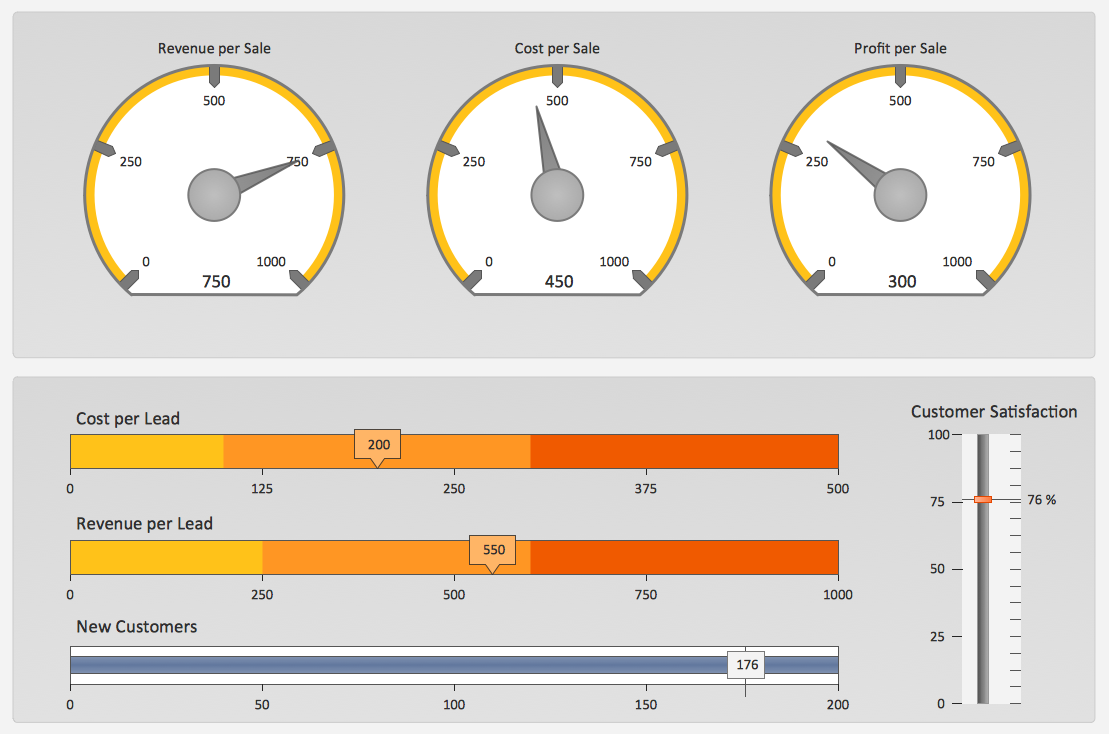
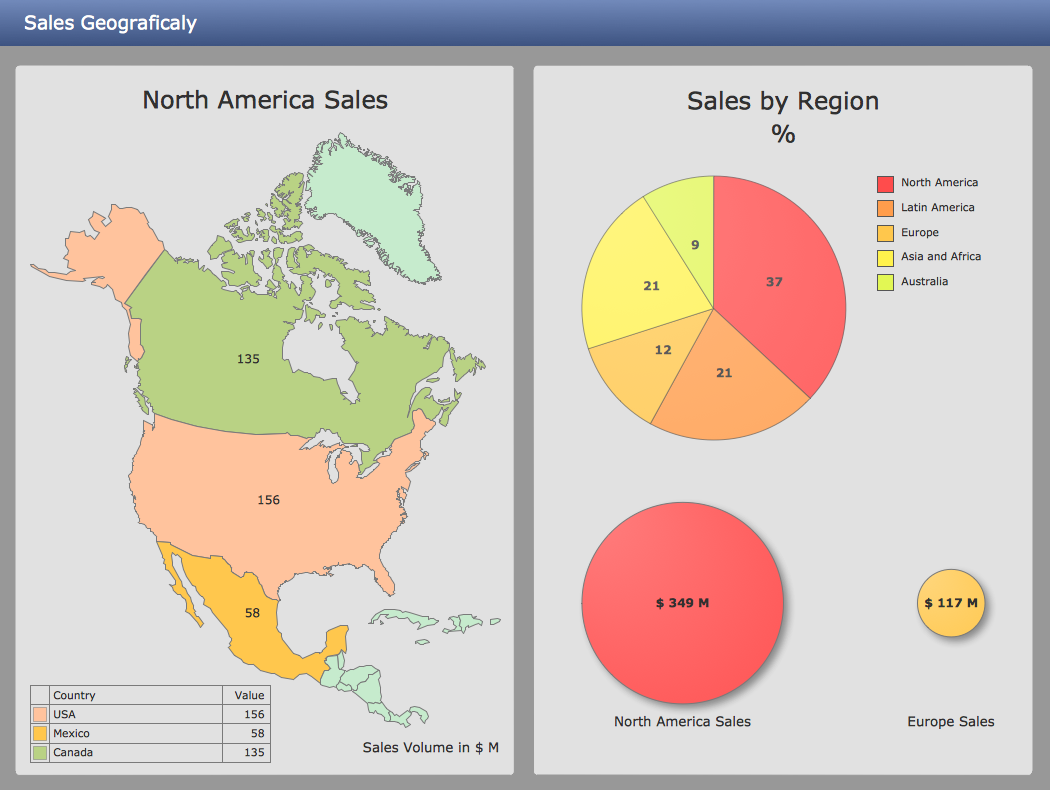
A combination of sales KPI on a one dashboard helps you track sales activities and results. Visualizing sales data using ConceptDraw PRO software extended with the Sales Dashboard solutiongives you flexibility in choosing and tuning KPIs.A KPI Dashboard
Composing a dashboard from different KPI is a kind of art. Visualizing sales data you have to keep balance to keep your dashboard informative, not messy. ConceptDraw Sales Dashboard solution gives you a set of good examples of balanced dashboards.A KPI Dashboard Provides the Answers Your Sales Team
Sales dashboard is a tool that provides the answers to all questions your sales team may have. A mature sales dashboard provides complete set of KPI to shows corporate, team or personal performance to keep sales process clear.KPIs and Metrics
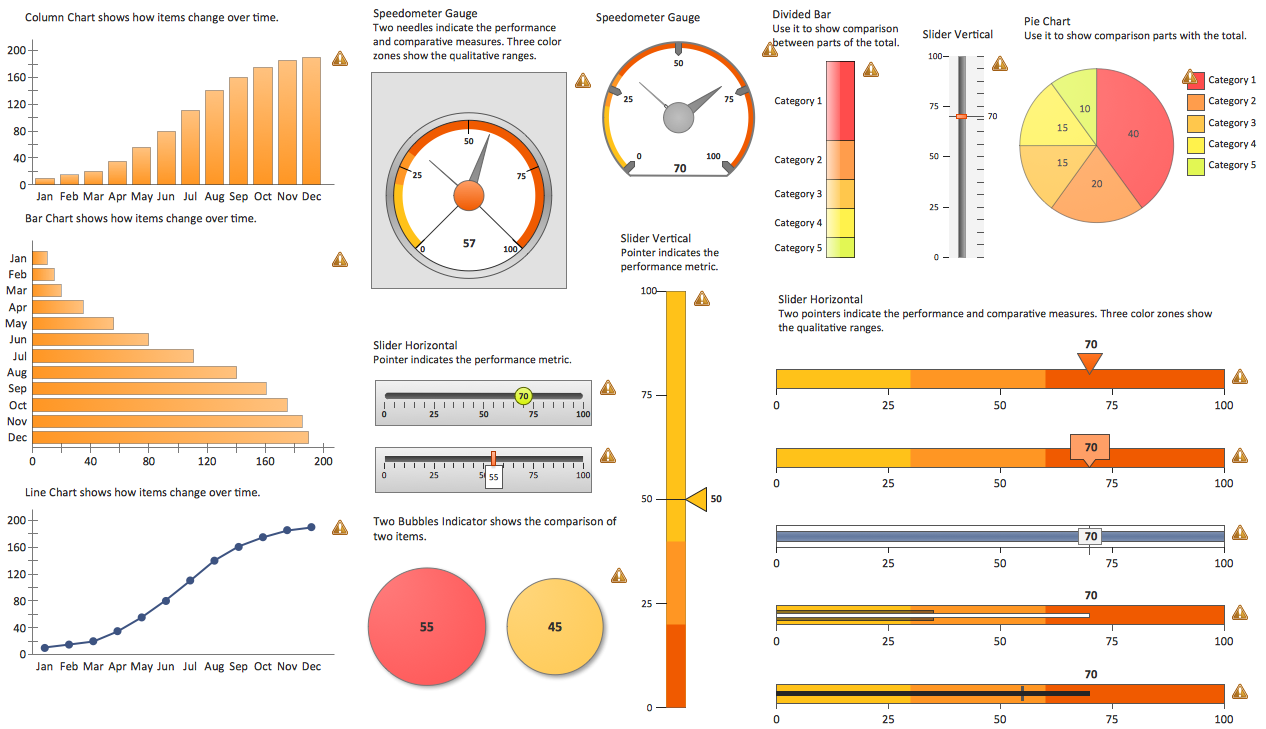
The choice of KPIs and metrics you use is key point of success when measuring sales process. Visualizing sales data using ConceptDraw Sales Dashboard solution for ConceptDraw PRO gives you a choice from numerous pre-designed indicators for different metrics you may need.Visualize Sales Data Using Sample Data
ConceptDraw PRO software extended with the Sales Dashboard solution allows you visualize sales data using sample data delivered with the solution to choose visual indicators you need, and then connect these indicators to your real data.Sales Dashboard Solutions can help your sales team keep an eye on performance
ConceptDraw Sales Dashboard Solution is a simple and effective way of visualizing sales data and get clear picture of your sales process to see how your business can improve.Ways You Can Visualize Sales Data
There are lots of ways you can visualize sales data, and the simplest way is using ConceptDraw Sales Dashboard solution for ConceptDraw PRO. You just need to connect your data to one of pre-designed dashboards, and then you can see dynamic picture of changes.
 Sales Dashboard
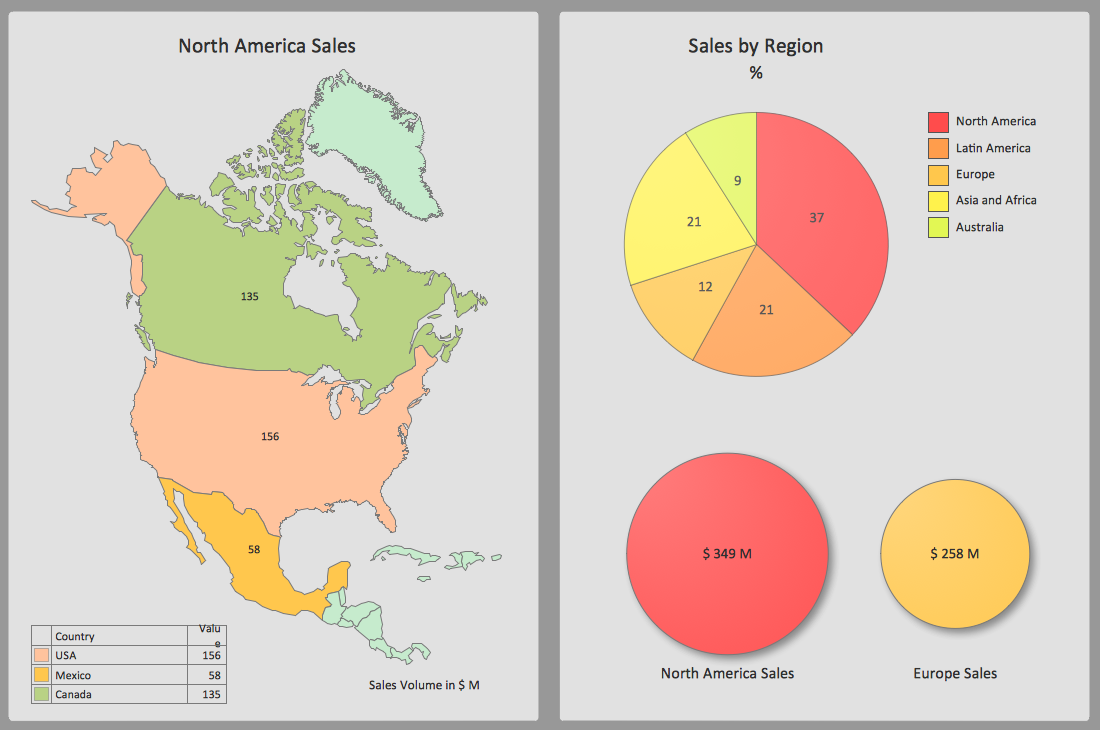
Sales Dashboard solution extends ConceptDraw PRO software with templates, samples and library of vector stencils for drawing the visual dashboards of sale metrics and key performance indicators (KPI).
Sales Organization
Sales organization becomes easier when you have proper tools to motivate your team and measure team and personal progress. ConceptDraw Sales Dashboard helps you in sales organization visualizing sales data that gives your team a visual appearance of their progress.Data Visualization Software Solutions
To see how your business can improve you can try data visualization software solutions that allows you visualize all your sales KPI in one sales dashboard allows you monitor and analyse sales activities.Data Visualization Solutions
Data visualization solutions help you to see how your business can improve. Visualizing sales data using ConceptDraw Sales Dashboard gives you a bird's-eye view of the sale process."Interrelationship digraph is a method to identify relationships among a set of items. Items that have a cause or effect associated on another item are linked together (and given weight) for the purpose of identifying the items most affected or items affecting other items the most, giving emphasis on those items for risk mitigation planning. Items involved in risk management could be risks being mitigated, risk strategies, project activities or resources. ...
This method fosters broad thinking of individuals to identify interrelationships of risk items that affect the whole project, determining critical risk areas that must be dealt first and ensures efficient allocation of project resources." [sce.uhcl.edu/ helm/ Risk_ Man_ WEB/ Planning%20 Worksheet%20 Notes_ files%5Cintrldgm.htm]
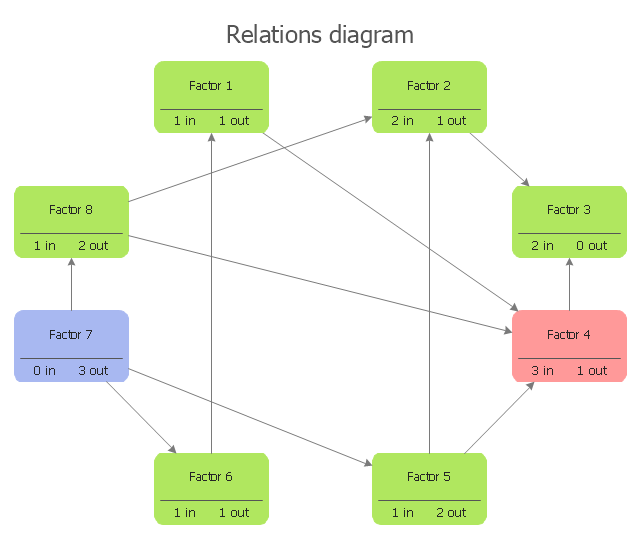
Relation diagram (interrelationship digraph, relationships digram) helps identify what factors are causes and which factors are effects. Factors help establish KPI (Key Performance Indicators) to monitor changes and the effectiveness of corrective actions in resolving a problem.
The relations diagram is one of the Seven Management and Planning Tools (7 MP tools, Seven New Quality Tools).
The relations diagram template for the ConceptDraw PRO diagramming and vector drawing software is included in the solution "Seven Management and Planning Tools" from the Management area of ConceptDraw Solution Park.
www.conceptdraw.com/ solution-park/ management-seven-mp-tools
Sales Dashboards for Your Company
ConceptDraw PRO software extended with the Sales Dashboard solution allows you produce sales dashboards for your company easily. You can start from samples and templates delivered with the solution and then modify them to get a dashboard that suites your specific needs.
 Meter Dashboard
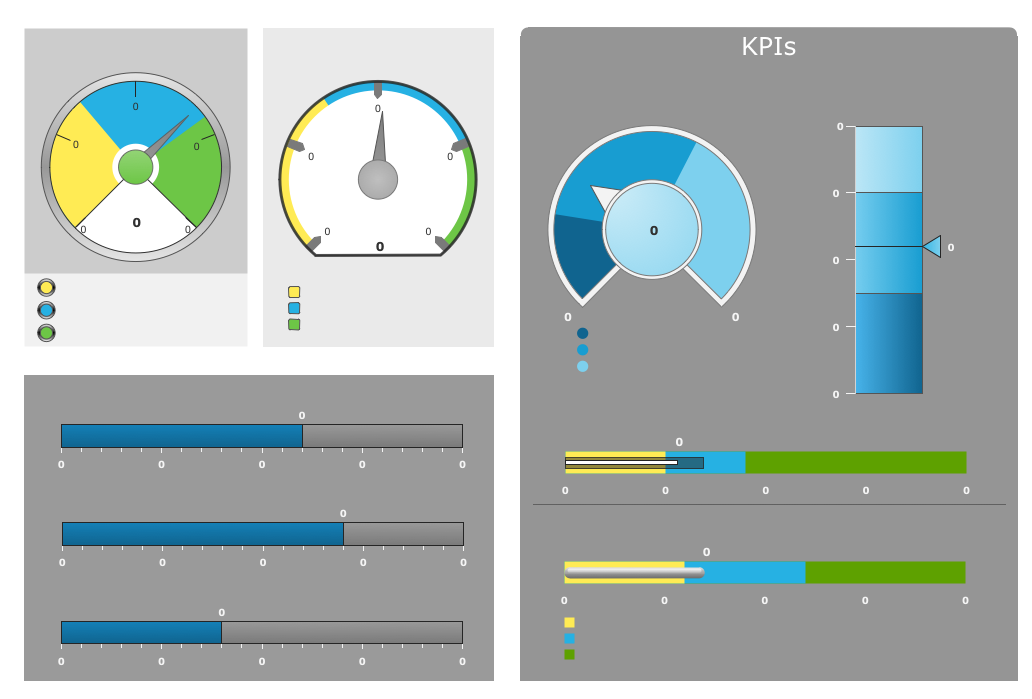
Meter dashboard solution extends ConceptDraw PRO software with templates, samples and vector stencils library with meter indicators for drawing visual dashboards showing quantitative data.
Sales Dashboard Screenshot
ConceptDraw PRO software exteneded with the Sales Dashboard solution is perfect for visualizing sales data. This is the best tool to analyse your sales perfornance and see how your business can improve.Reporting Dashboard Software for Business
An effective way to improve your business is using reporting dashboard software. ConceptDraw PRO software extended with the Sales Dashboard solution helps you monitor all KPI on the one screen in real time.
 Composition Dashboard
Composition dashboard solution extends ConceptDraw PRO software with templates, samples and vector stencils library with charts and indicators for drawing visual dashboards showing data composition.
- Sales KPI Dashboards | A KPI Dashboard | A ... - Conceptdraw.com
- A KPI Dashboard | A KPI Dashboard Provides the Answers Your ...
- Sales Dashboard Template | Sales KPI Dashboards | Visualize ...
- A KPI Dashboard Provides the Answers Your Sales Team | Sales ...
- Sales Dashboard Solutions can help your sales team keep an eye ...
- Sales Dashboard | Meter Dashboard | PM Dashboards |
- A KPI Dashboard Provides the Answers Your Sales Team
- Sales Dashboard Template | Sales KPI ... - Conceptdraw.com
- Sales KPI Dashboards | Sales Dashboard Template | A KPI
- Sales KPI Dashboards | A KPI Dashboard | A KPI Dashboard ...
- Relations diagram template | Constant improvement of key ...
- Sales KPI Dashboards | A KPI Dashboard Provides the Answers ...
- A KPI Dashboard | A KPI Dashboard Provides the Answers Your ...
- A KPI Dashboard | A KPI Dashboard Provides the Answers Your ...
- KPIs and Metrics | Spatial Dashboard | Correlation Dashboard |
- Constant improvement of key performance indicators | A KPI ...
- Sales KPI Dashboards | A KPI Dashboard | KPIs and Metrics |
- A KPI Dashboard Provides the Answers Your Sales Team | How To ...
- Reporting & Data Visualization | Sales KPI Dashboards | Sales ...
- PM Dashboards | What is a Dashboard Area | Sales KPI Dashboards |
