Lean Manufacturing Diagrams
The Value Stream Mapping solution continues to extend the range of ConceptDraw DIAGRAM into a business graphics tool that can be used to document processes of Lean Manufacturing.Lean Six Sigma Diagram Software
Lean Six Sigma (LSS) is a well-known in all over the world methodology of quality improvement and business perfection. ConceptDraw DIAGRAM diagramming and vector drawing software is a powerful Lean Six Sigma Diagram Software thanks to the included Value Stream Mapping solution from the Quality Management Area of ConceptDraw Solution Park.The Lean Enterprise Value Stream Mapping
Create value stream maps - for value stream analysis and value stream management, material and information flow mapping, using our quick start templates included with ConceptDraw.Lean Management
Lean management is an approach to running an organization which seeks to decrease the waste of time, effort or money by identifying each step of a business process. Lean management actively supports the concept of continuous improvement, a long-term approach to work and aspires to the improvement of efficiency and quality. ConceptDraw DIAGRAM extended with Value Stream Mapping solution from the Quality area of ConceptDraw Solution Park is effective software in the field of the lean management.Value Stream Mapping for the Lean Office
Value Stream Mapping for the lean office is a tool that uses a flow diagram to document in great detail every step of a manufacturing process.Lean Value Stream Map
Lean Manufacturing tool is a new Value Stream Mapping solution found in the ConceptDraw Solution Park.Lean Manufacturing
Lean manufacturing or lean production is a concept of organization's management which is based on the constant effort to eliminate all kinds of losses. Lean manufacturing requires involvement of each employee in the process of business optimization and maximum customer orientation. ConceptDraw DIAGRAM diagramming and vector drawing software enhanced with Value Stream Mapping solution from the Quality area of ConceptDraw Solution Park is perfect for the lean manufacturing.Cause and Effect Diagram
ConceptDraw DIAGRAM software extended with Fishbone Diagrams solution from the Management area of ConceptDraw Solution Park is perfect for Cause and Effect Diagram creating. It gives the ability to draw fishbone diagram that identifies many possible causes for an effect or a problem. Causes and Effects are usually grouped into major categories to identify these sources of variation. Causes and Effects in the diagram show relationships among various factor. Fishbone diagram shows factors of Equipment, Process, People, Materials, Environment and Management, all affecting the overall problem.Lean Value Stream Mapping
Value Stream Mapping solution assists practitioners of Lean Manufacturing in building Value Stream Mapping representations of processes.Cause and Effect Analysis
When you have some problems you need first to explore the reasons which caused them. Cause and Effect Analysis is a perfect way to do this. ConceptDraw DIAGRAM software enhanced with Fishbone Diagrams solution from the Management area of ConceptDraw Solution Park gives the ability to draw fast and easy Fishbone diagram that identifies many possible causes for an effect.Lean Value Stream
ConceptDraw Value Stream Mapping is a Lean Manufacturing tool that uses a flow diagram to document in great detail every step of a manufacturing process.Value Stream Analysis
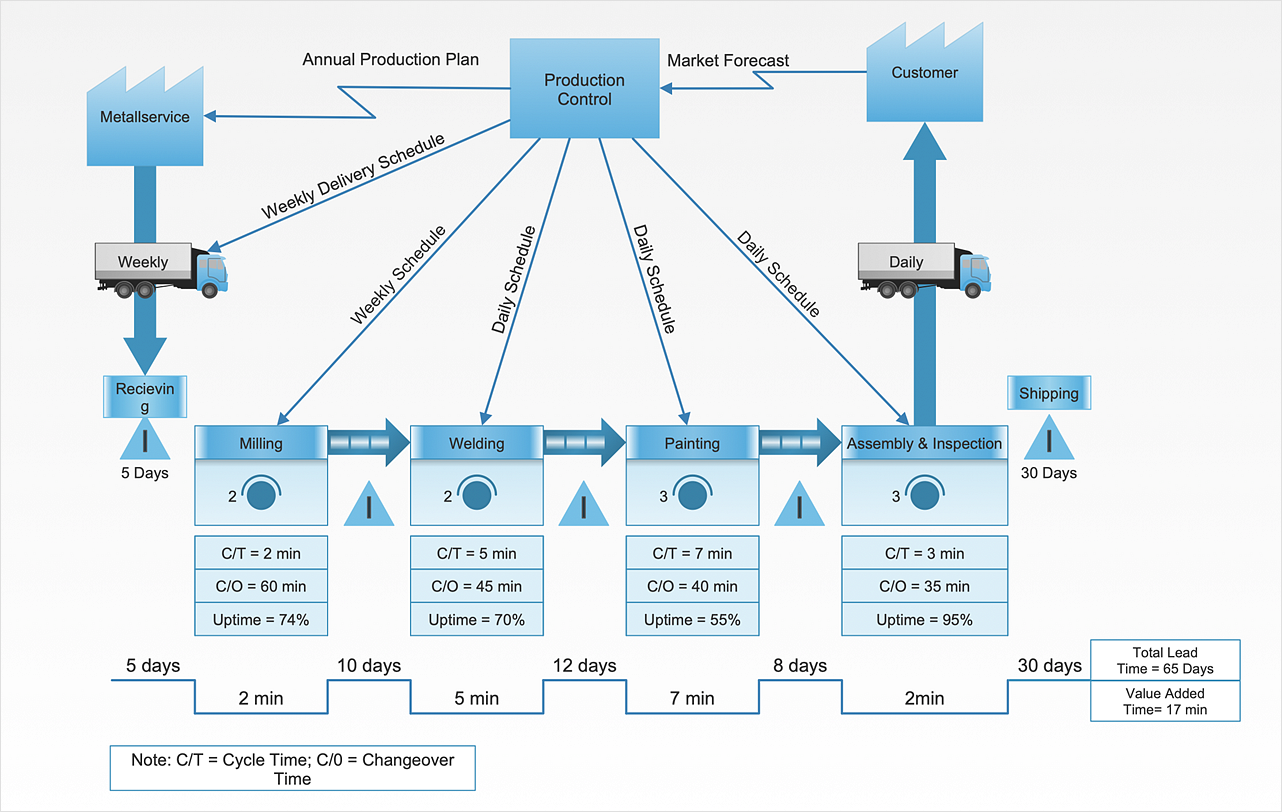
ConceptDraw Value Stream Maps are used in lean practice for analysis of manufacturing processes to identify the improvement opportunities.What is Value Stream Mapping?
Value stream maps (VSM) are an essential tool for organizations applying Lean methods.Value-Stream Mapping for Manufacturing
Create value stream maps - for value stream analysis and value stream management, material and information flow mapping, using our quick start templates included with ConceptDraw.Best Value Stream Mapping mac Software
Create value stream maps - for value stream analysis and value stream management, material and information flow mapping, using our quick start templates included with ConceptDraw.HelpDesk
How to Create a VSM Diagram Using Solutions
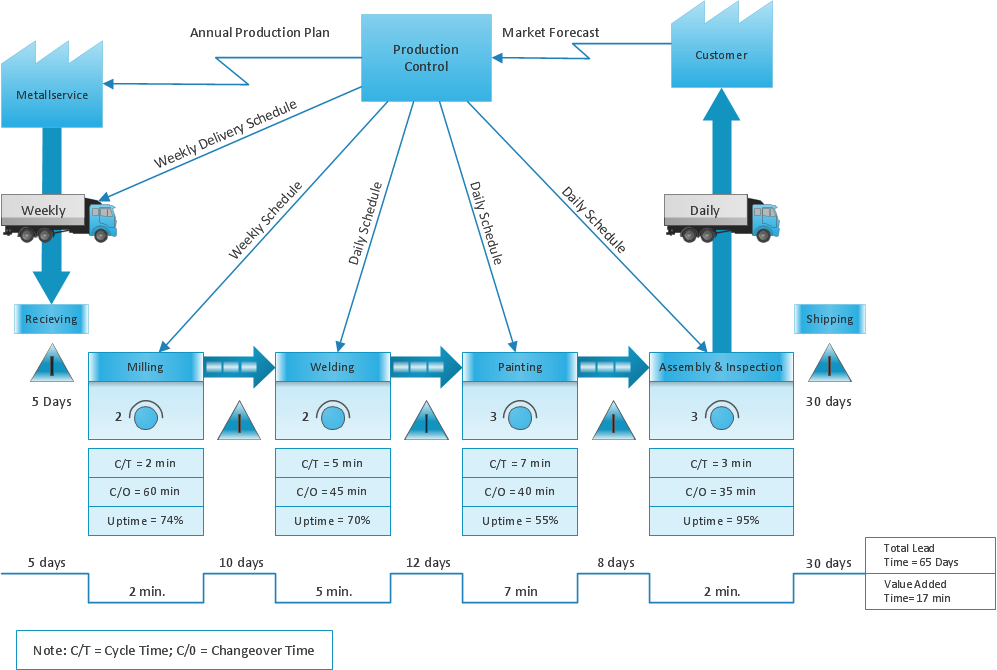
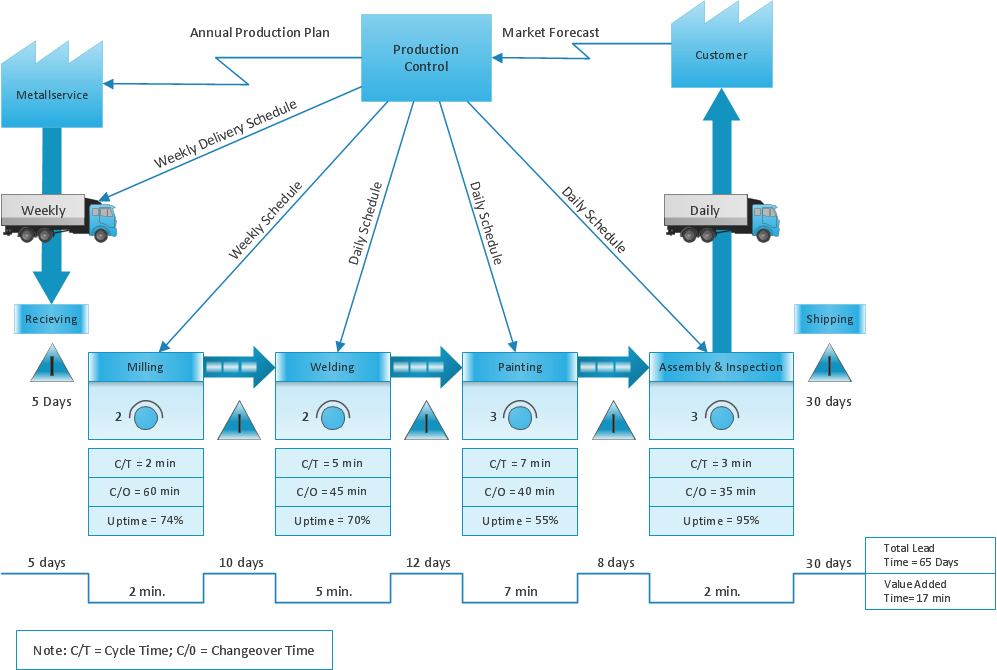
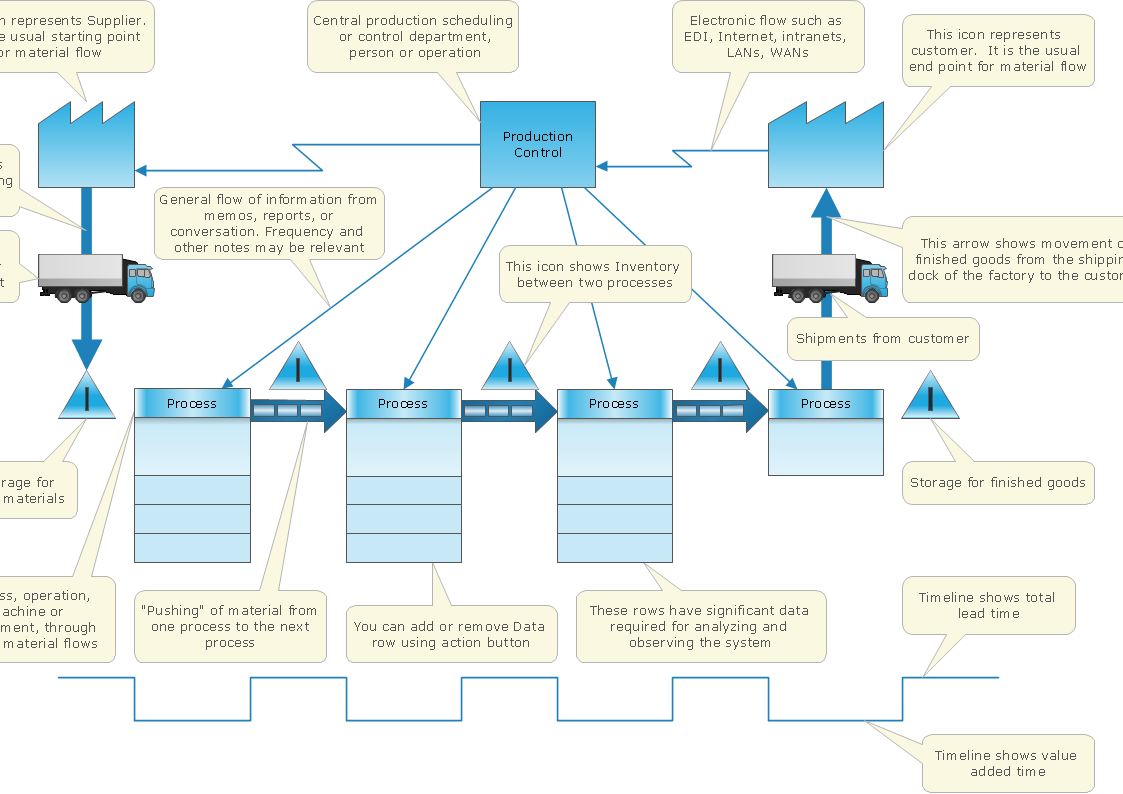
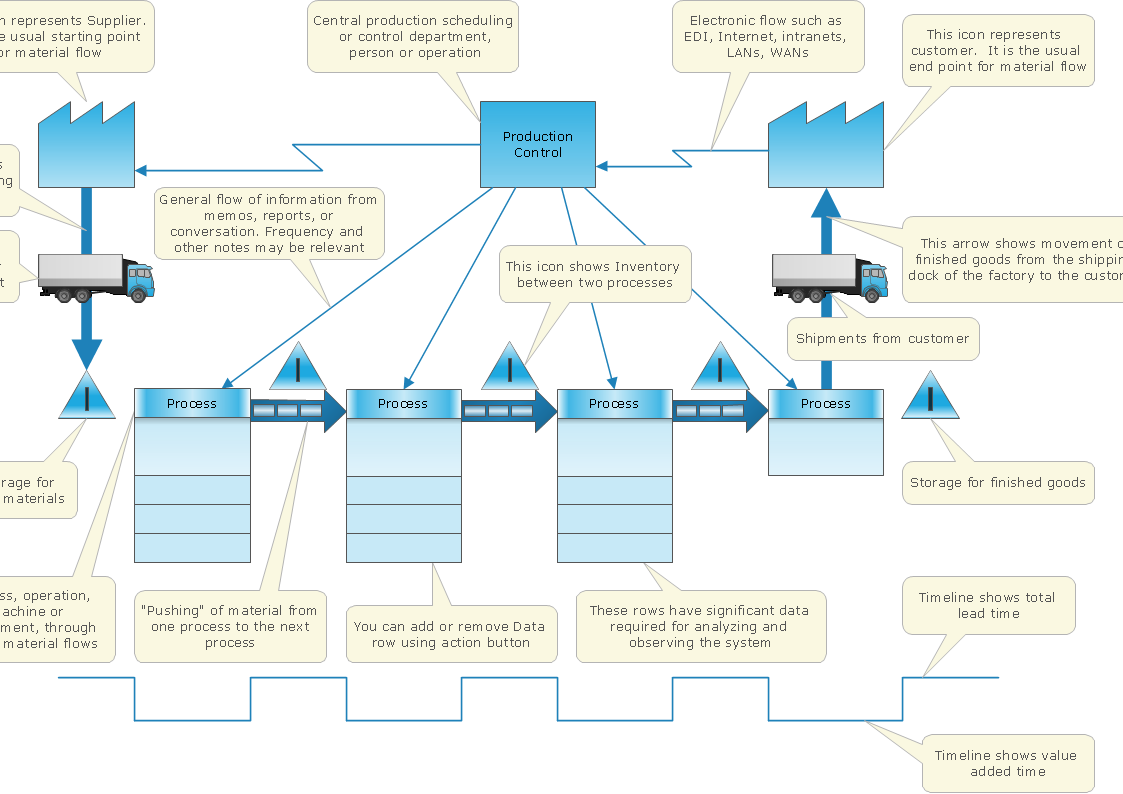
Value Stream Mapping is a Lean Manufacturing tool that uses a flow diagram to document in great detail every step of a manufacturing process. This graphical representation of a process is a powerful tool that helps in the diagnosis of process efficiency and allows companies to develop improved processes. Many lean practitioners use Value Stream Mapping as a fundamental tool to identify waste, cut process cycle times, and implement process improvement. Many organizations use value stream mapping as a key portion of their lean efforts. Value Stream Maps are used to analyze and design the flow of materials and information required to bring a product or service to a consumer. You can create a Value Stream Mapping flowchart using ConceptDraw DIAGRAM tools.Project management - Design Elements
These vector illustrations and cliparts are created using ConceptDraw DIAGRAM for drawing the Project management Illustrations and contain plenty of project management design elements. The clipart library Project management includes 35 icons. This symbols used by the best marketing project management software, typically by project management reporting software for presentation on project status and results.Cross Functional Flowchart Shapes Stencil
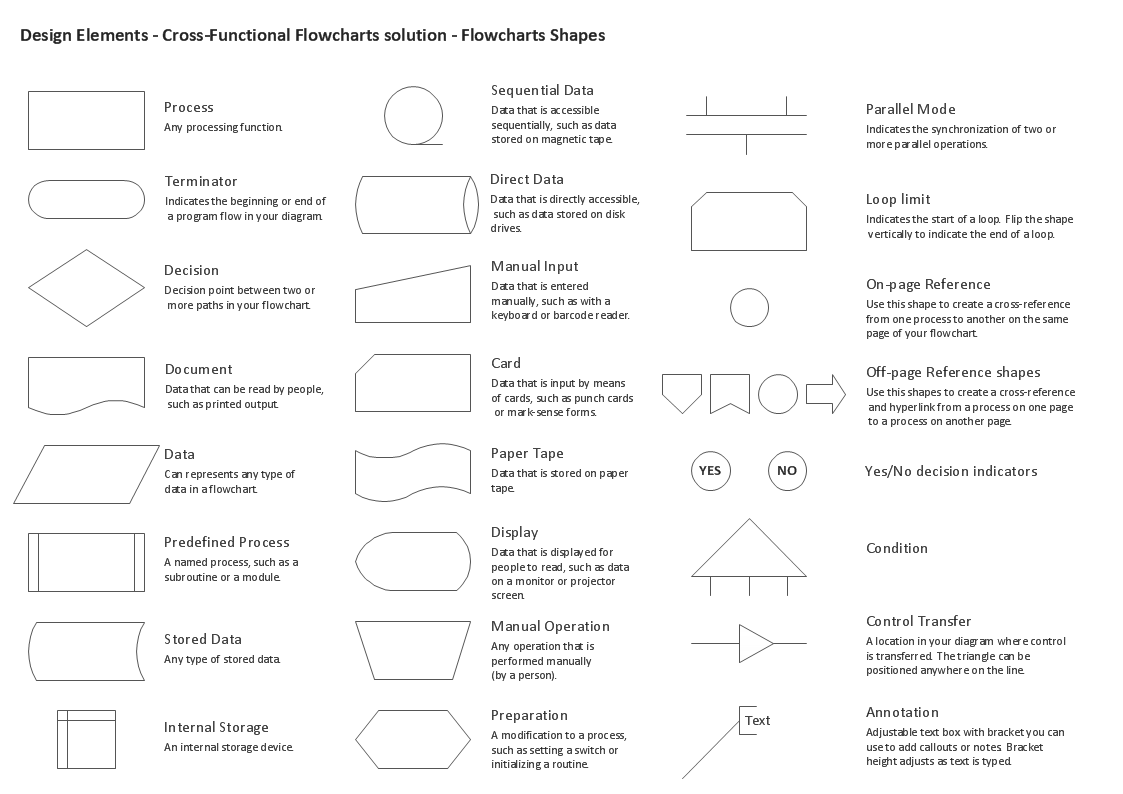
ConceptDraw DIAGRAM diagramming software provides vector shapes and connector tools for quick and easy drawing diagrams for business, technology, science and education. ConceptDraw Solution Park include professional set of libraries for Cross Functional Flowchart Shapes StencilBusiness Process Flowchart
Cross-functional (deployment) flowcharts visualize what functional units (people, departments or functional areas) are responsible for the business process operations. The flowcharts are divided into rows/columns of functional units. Blocks of various shapes represent the process steps, and are placed in rows/columns of the responsible functional units.Learn how to create a current state value stream map
Value Stream Mapping solution extends ConceptDraw DIAGRAM software with templates, samples and vector shapes for drawing the current state value stream maps.- Lean Manufacturing Diagrams | Lean Value Stream Map | Value ...
- Lean Manufacturing Diagrams | Value-Stream Mapping for ...
- Process Flowchart | Basic Flowchart Symbols and Meaning | Lean ...
- Lean Manufacturing Diagrams | Value Stream Mapping | Types of ...
- Lean Manufacturing Diagrams | Manufacturing 8 Ms fishbone ...
- Design elements - SIPOC diagrams | Lean Six Sigma Symbols And ...
- Blank Calendar | Bubble Chart | Lean Manufacturing Diagrams | Plot ...
- The Lean Enterprise Value Stream Mapping | Enterprise ...
- Process Flowchart | Data Flow Diagram | Lean Six Sigma Diagram ...
- Value Stream Mapping for the Lean Office | IDEF0 Diagrams | DFD ...
- Sector diagram - Template | New Zealand Public Sector Agencies ...
- PERT chart - Template | PROBLEM ANALYSIS. Prioritization Matrix ...
- Process Flowchart | Lean Six Sigma Diagram Software | Competitor ...
- Best Value — Total Quality Management | Pie Chart Examples and ...
- Process Flow Chart Symbol | Lean Six Sigma Diagram Software ...
- Flow chart Example. Warehouse Flowchart | Flowchart on Bank ...
- Lean Six Sigma Diagram Software | Process Flow Chart Symbol ...
- Manufacturing 8 Ms fishbone diagram - Template | Value-Stream ...
- Flow chart Example. Warehouse Flowchart | Cross Functional ...


