"A catalog merchant (catalogue merchant in British and Canadian English) is a form of retailing. The typical merchant sells a wide variety of household and personal products, with many emphasizing jewelry. Unlike a self-serve retail store, most of the items are not displayed; customers select the products from printed catalogs in the store and fill out an order form. The order is brought to the sales counter, where a clerk retrieves the items from the warehouse area to a payment and checkout station. ...
The catalog merchant has generally lower prices than other retailers and lower overhead expenses due to the smaller size of store and lack of large showroom space.
There are a few key benefits to this approach. By operating as an in-store catalog sales center, it could be exempt from the "Resale price maintenance" policy of the manufacturers, which can force conventional retailers to charge a minimum sales price to prevent price-cutting competition; it also reduces the risk of merchandise theft, known in the industry as shrinkage.
From the consumer's point of view, there are potential advantages and disadvantages. The catalog showroom approach allows customers to shop without having to carry their purchases throughout the store as they shop. Possible downsides include that customers may be required to give their contact information when an order is placed, take the time to fill out order forms, and wait a period of time for their order to be available for purchase. This wait may be days long, one of the chief vulnerabilities of the catalog showroom approach." [Catalog merchant. Wikipedia]
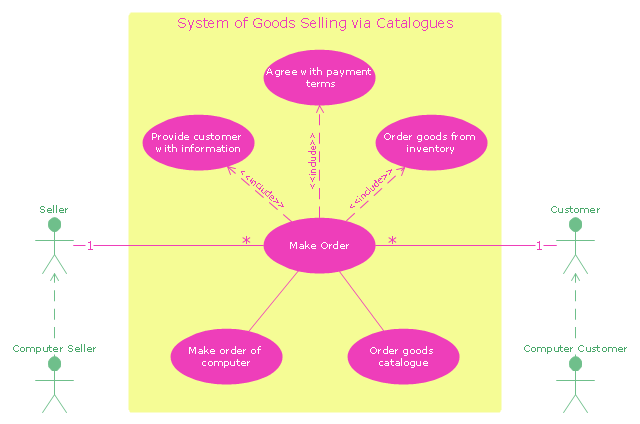
The UML use case diagram example "System of goods selling via catalogues" was created using the ConceptDraw PRO diagramming and vector drawing software extended with the Rapid UML solution from the Software Development area of ConceptDraw Solution Park.
Jackson Structured Programming (JSP) Diagrams
The Jackson Structured Programming (JSP) Diagram solution extends the functionality and drawing abilities of the ConceptDraw DIAGRAM software with set of illustrative JSP diagrams samples and large variety of predesigned vector objects of actions, processes, procedures, selection, iteration, as well as arrows and connectors to join the objects during Jackson structured development and designing Jackson structured programming diagrams, JSP diagram, Jackson structure diagram (JSD), Program structure diagram. The powerful abilities of this solution make the ConceptDraw DIAGRAM ideal assistant for programmers, software developers, structural programmers, computer engineers, applications constructors, designers, specialists in structured programming and Jackson systems design, and other technical, computer and software specialists.
Bar Chart Software
The best bar chart software ever is ConceptDraw. ConceptDraw bar chart software provides an interactive bar charting tool and complete set of predesigned bar chart objects.ConceptDraw Arrows10 Technology
When you are connecting existing objects you can control the diagram structure by changing selection order. This is how diagramming software should work. You are able to draw a diagram as quickly as the ideas come to you.Employment Form Software
Basic Diagramming Solution contains a wide set of the ready-to-use vector stencils and professional predesigned employment forms and diagrams. These employment forms will help you in the process of management, recruiting and hiring the employees. It's very easy and convenient to use the employment form templates from the Basic Diagramming Solution for ConceptDraw DIAGRAM as the base for creating your own employment forms.Work Order Process Flowchart. Business Process Mapping Examples
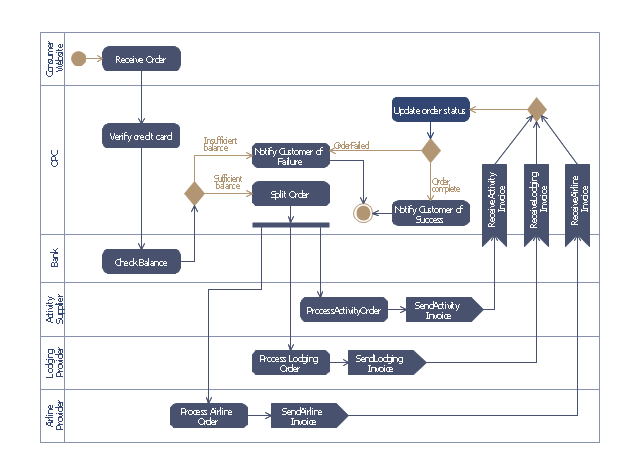
The business process is a set of actions or tasks which are undertaken by an organization for production some goods or services, they are then offered for the customers and are ordered by them. Process Flowcharts and Order Process Flowcharts are sufficiently prevalent, well known and actively used in variety of fields of life, business and science. They are constructed using the common standardized symbols, thus are clear and understandable for all. They help effectively represent the processes, determine the order in which the process activities happen, document the order processes, and also effectively analyze the processes with a goal to increase their efficiency. Create your own Process Flowcharts, Order Process Flowcharts, Cross-Functional Flow Charts representing the order processing steps using powerful drawing tools of ConceptDraw DIAGRAM software and variety of predesigned vector objects from the libraries of Business Process Mapping Solution from Business Processes area of ConceptDraw Solution Park.This purchase order processing UML activity diagram was created on the base of activity diagram from the software architecture documentation wiki of the Software Engineering Institute (SEI) of Carnegie Mellon University (CMU).
[wiki.sei.cmu.edu/ sad/ index.php/ Image:PurchaseOrderActivityDiagram.png]
"A purchase order (PO) is a commercial document and first official offer issued by a buyer to a seller, indicating types, quantities, and agreed prices for products or services. Acceptance of a purchase order by a seller forms a contract between the buyer and seller, so no contract exists until the purchase order is accepted. It is used to control the purchasing of products and services from external suppliers.
Creating a purchase order is typically the first step of the purchase to pay process in an ERP system." [Purchase order. Wikipedia]
This purchase order processing UML activity diagram example was created using the ConceptDraw PRO diagramming and vector drawing software extended with the ATM UML Diagrams solution from the Software Development area of ConceptDraw Solution Park.
Material Requisition Flowchart. Flowchart Examples
Material requisition is a request generated by internal or external organization with a goal to inform the purchase department about the needed items and materials. The requisition can be represented as a written document on a pre-printed form or online request in form of electronic document. The electronic inquisition occupies a leading position in a modern world, now the paper forms are replaced by electronic ordering processes and workflows. The requisition is actively used in business as an internal document for notification the store about the needed goods, in medicine for making the orders on medical equipment and medicaments, in industry for creation request for purchasing some items and materials, and so on. ConceptDraw DIAGRAM ector graphics software extended with Flowcharts solution from the Diagrams area is powerful and useful tool for drawing various types of Flowcharts, including without doubt the Material Requisition Flowchart of any degree of detailing. Succeed in drawing using the large quantity of predesigned flowchart specific shapes, symbols and icons."Communication diagram (called collaboration diagram in UML 1.x) is a kind of UML interaction diagram which shows interactions between objects and/ or parts (represented as lifelines) using sequenced messages in a free-form arrangement.
Communication diagram corresponds (i.e. could be converted to/ from or replaced by) to a simple sequence diagram without structuring mechanisms such as interaction uses and combined fragments. It is also assumed that message overtaking (i.e., the order of the receptions are different from the order of sending of a given set of messages) will not take place or is irrelevant." [uml-diagrams.org/ communication-diagrams.html]
The template "UML communication diagram" for the ConceptDraw PRO diagramming and vector drawing software is included in the Rapid UML solution from the Software Development area of ConceptDraw Solution Park.
www.conceptdraw.com/ solution-park/ software-uml
Computer and Networks Area
The solutions from Computer and Networks Area of ConceptDraw Solution Park collect samples, templates and vector stencils libraries for drawing computer and network diagrams, schemes and technical drawings.
This IDEF3 diagram example was redesigned from the Wikimedia Commons file: 2-02 Example of a Transition Schematic.jpg.
[commons.wikimedia.org/ wiki/ File:2-02_ Example_ of_ a_ Transition_ Schematic.jpg]
"The schematic in Figure 2-2 represents an Object Schematic for the Order Material scenario derived from the business owner’s description. This example happens to illustrate a Transition Schematic since it characterizes the nature and structure of object state transitions for occurrences of the Order Material scenario. A key document in this process is the Purchase Request form. This form is eventually transformed into a Purchase Order (PO) via the Order Material process. A circle containing the name of an object represents an object of a certain kind (e.g., Purchase Request, Account Manager, Project). These labeled circles are known as kind symbols. A certain kind of object being in a certain state is represented by a circle with a label that captures both the kind itself and a corresponding state, thereby representing the type (or class) of objects that are in that state (within a given process). ... One of the first steps to develop an Object Schematic is to identify the possible states in which the object can exist. Though a real-world object often evolves through a continuum of states, an Object Schematic focuses on those distinguished states of particular interest to the domain expert. The transition arcs (arrows with triangular, filled-in heads) connecting the circles symbolize a state transition, the activity of changing from one state to another. The conditions that establish when an object is in a given state, how it exists a state, how it can transition between states, and how it can enter a new state are recorded on a special form. The banded boxes linked to the arrows (called referents) are aids to describe the relationships between objects states and UOBs, scenarios, or other Transition Schematics that participate in a scenario occurrence. ... The transition junctions containing an “X” (for exclusive or) indicate the choice of exactly one path among several possible paths in an occurrence." [IDEF3 Process Description Capture Method Report AL-TR-1995-XXXX. idef.com/ pdf/ Idef3_ fn.pdf]
The diagram "Transition schematic - IDEF3 diagram example" was created using the ConceptDraw PRO diagramming and vector drawing software extended with the solution "IDEF Business Process Diagrams" from the area "Business Processes" of ConceptDraw Solution Park.
Sequence Diagram Tool
ConceptDraw DIAGRAM diagramming and vector drawing software as a sequence diagram tool provides the Rapid UML Solution from the Software Development Area that contains the UML Sequence library."Communication diagram (called collaboration diagram in UML 1.x) is a kind of UML interaction diagram which shows interactions between objects and/ or parts (represented as lifelines) using sequenced messages in a free-form arrangement.
Communication diagram corresponds (i.e. could be converted to/ from or replaced by) to a simple sequence diagram without structuring mechanisms such as interaction uses and combined fragments. It is also assumed that message overtaking (i.e., the order of the receptions are different from the order of sending of a given set of messages) will not take place or is irrelevant." [uml-diagrams.org/ communication-diagrams.html]
The template "UML communication diagram" for the ConceptDraw PRO diagramming and vector drawing software is included in the Rapid UML solution from the Software Development area of ConceptDraw Solution Park.
www.conceptdraw.com/ solution-park/ software-uml
S Video Connection
S-Video is a signaling standard for standard definition video. ConceptDraw DIAGRAM diagramming and vector drawing software extended with Audio and Video Connectors Solution from the Industrial Engineering Area can be helpful for demostrating and explaining the S Video connection which is widely used on TVs and home theater receivers.SWOT Template
The SWOT and TOWS Matrix Diagrams solution from the ConceptDraw Solution Park gives a simple visual support for all steps of a SWOT analysis process, which is a popular strategic planning method used to evaluate the Strengths, Weaknesses, as well as Opportunities and Threats facing a project. Strengths are the project's characteristics giving it the advantages over the others, weaknesses are the characteristics placing the team at the disadvantage relatively to others, opportunities are the elements that the project can exploit to its advantage and threats are the elements that can cause the troubles. The results of a correctly performed SWOT analysis help to achieve effectively the main objective. The SWOT templates included to SWOT and TOWS Matrix Diagrams solution for ConceptDraw DIAGRAM isually support the identifying of internal and external factors that are favorable or unfavorable. Making the SWOT analysis and completing the SWOT Matrix by simple filling a SWOT template, you can then export it to large variety of available formats: PowerPoint presentation, PDF, image files, and others.Software Engineering
For database modeling, such as graph databases and/or relational databases modelling, for business rules modeling, for XML-Schemas modeling, data warehouses modeling or for web forms modeling — it does not matter what your reasons for creating the ORM diagrams are, you can always make any needed ORM-related drawings with the aid of ConceptDraw DIAGRAM and ConceptDraw STORE that can simplify your work by providing the so-called “Object-Role Modeling (ORM) solution” as a great ORM diagram drawing tool, including the ORM-related vector stencils libraries, ORM diagram samples and templates as well as learning media.Basic of Flowchart: Meaning and Symbols
Flowcharts are the best for visually representation the business processes and the flow of a custom-order process through various departments within an organization. ConceptDraw DIAGRAM diagramming and vector drawing software extended with Flowcharts solution offers the full set of predesigned basic flowchart symbols which are gathered at two libraries: Flowchart and Flowcharts Rapid Draw. Among them are: process, terminator, decision, data, document, display, manual loop, and many other specific symbols. The meaning for each symbol offered by ConceptDraw gives the presentation about their proposed use in professional Flowcharts for business and technical processes, software algorithms, well-developed structures of web sites, Workflow diagrams, Process flow diagram and correlation in developing on-line instructional projects or business process system. Use of ready flow chart symbols in diagrams is incredibly useful — you need simply drag desired from the libraries to your document and arrange them in required order. There are a few serious alternatives to Visio for Mac, one of them is ConceptDraw DIAGRAM. It is one of the main contender with the most similar features and capabilities.The vector stencils library "UML communication diagrams" contains 23 symbols for the ConceptDraw PRO diagramming and vector drawing software.
"... communication diagrams use the free-form arrangement of objects and links as used in Object diagrams. In order to maintain the ordering of messages in such a free-form diagram, messages are labeled with a chronological number and placed near the link the message is sent over. Reading a communication diagram involves starting at message 1.0, and following the messages from object to object." [Communication diagram. Wikipedia]
The example "Design elements - UML communication diagrams" is included in the Rapid UML solution from the Software Development area of ConceptDraw Solution Park.
Seven Management and Planning Tools
Seven Management and Planning Tools solution extends ConceptDraw DIAGRAM and ConceptDraw MINDMAP with features, templates, samples and libraries of vector stencils for drawing management mind maps and diagrams.
Bar Chart Examples
Complete set of bar chart examples is produced using ConceptDraw software. Surfing bar chart examples you can find an example that is the best for your case.- New business opportunity SWOT analysis matrix - Template portrait ...
- Purchase order processing UML activity diagram | Business Process ...
- UML use case diagram | Product Order Form
- Form Maker | Process Flowchart | Software Request Form Template
- Purchase Process Flow Chart, Receiving Process Flow Chart ...
- Computer and Networks Area | Order Forms Template
- Sample Product Order Forms
- Form Maker | Template Order Form Template
- Computer and Networks Area | Draw A Typical Order Form
- Transition schematic - IDEF3 diagram example | Form Order