"Value Stream Map (VSM)
1. A tool used to improve a process by identifying added value and eliminating waste.
2. A process map that follows the value creation process.
A. “strap yourself to the product (or service) and see where you go”
3. A process map with data added.
A. Times: processing, wait, cycle.
B. Quality: number of rejects.
C. Inventory.
D. Resources.
1) Number of people.
2) Space.
3) Distance traveled.
E. Whatever else is useful for analyzing the process." [ocw.mit.edu/ courses/ aeronautics-and-astronautics/ 16-660j-introduction-to-lean-six-sigma-methods-january-iap-2012/ lecture-notes/ MIT16_ 660JIAP12_ 1-6.pdf]
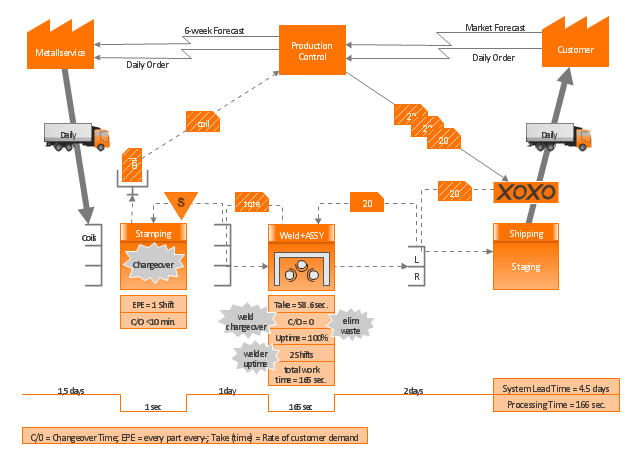
This sample VSM flowchart shows the value stream in a manufacturing, production control and shipping processes.
This value stream mapping diagram example was created using the ConceptDraw PRO diagramming and vector drawing software extended with the Value Stream Mapping solution from the Quality area of ConceptDraw Solution Park.
HelpDesk
How to Start Drawing a Diagram on Mac
In this tutorial we will explain how to create a simple chart in ConceptDraw PRO using a template, and how to use the library objects.HelpDesk
How to Draw a Fishbone Diagram with ConceptDraw PRO
Fishbone (Ishikawa) Diagram is often used in business to determine the cause of some problem. A Fishbone diagram is also called cause-and-effect diagram.The main goal of the Fishbone diagram is to illustrate in a graphical way the relationship between a given outcome and all the factors that influence this outcome. The complete diagram resembles a fish skeleton as its name implies. Cause and Effect analysis is used in management to identify the possible causes of a problem in order to eliminate them. The ability to create a Fishbone Diagram is supported by the Fishbone Diagram solution.- Basic Flowchart Symbols and Meaning | Wot Is D Flow Chart Symbol ...
- Flowchart design. Flowchart symbols, shapes, stencils and icons ...
- Affinity diagram - Implementing continuous process improvement ...
- Basic Flowchart Symbols and Meaning | UML Business Process ...
- How To use House Electrical Plan Software | Process Flowchart ...
- Remote Presentation for Skype | Draw D Uml Diagram Of ...
- Solve An Algorithm Program About D Quadratic Equation
- IDEF0 standard with ConceptDraw PRO | Entity Relationship ...
- 2 D Truck Drawing
- Plant Layout Plans | Trees and plants - Vector stencils library ...
- Flowchart design. Flowchart symbols, shapes, stencils and icons ...
- Dfd D
- Credit Card Processing System UML Diagram | Credit Card Order ...
- Data Flow Diagram Symbols. DFD Library | Basic Flowchart ...
- Cross-Functional Flowchart | Examples of Flowcharts, Org Charts ...
- Sales Process Flowchart. Flowchart Examples | Basic Audit ...
- Swim Lane Diagrams | Cross-Functional Flowchart (Swim Lanes ...
- Process Flowchart | How to Draw a Flowchart | Flowchart design ...
- Copying Service Process Flowchart. Flowchart Examples | Flowchart ...
- Basic Flowchart Images. Flowchart Examples | Process Flowchart ...


