Software development with ConceptDraw DIAGRAM
Modern software development requires creation of large amount of graphic documentation, these are the diagrams describing the work of applications in various notations and cuts, also GUI design and documentation on project management. ConceptDraw DIAGRAM technical and business graphics application possesses powerful tools for software development and designing technical documentation for object-oriented projects. Solutions included to the Software Development area of ConceptDraw Solution Park provide the specialists with possibility easily and quickly create graphic documentation. They deliver effective help in drawing thanks to the included package of templates, samples, examples, and libraries with numerous ready-to-use vector objects that allow easily design class hierarchies, object hierarchies, visual object-oriented designs, flowcharts, GUI designs, database designs, visualize the data with use of the most popular notations, including the UML and Booch notations, easy manage the development projects, automate projection and development.HelpDesk
How to Add a Self-Drawn Object to a Library
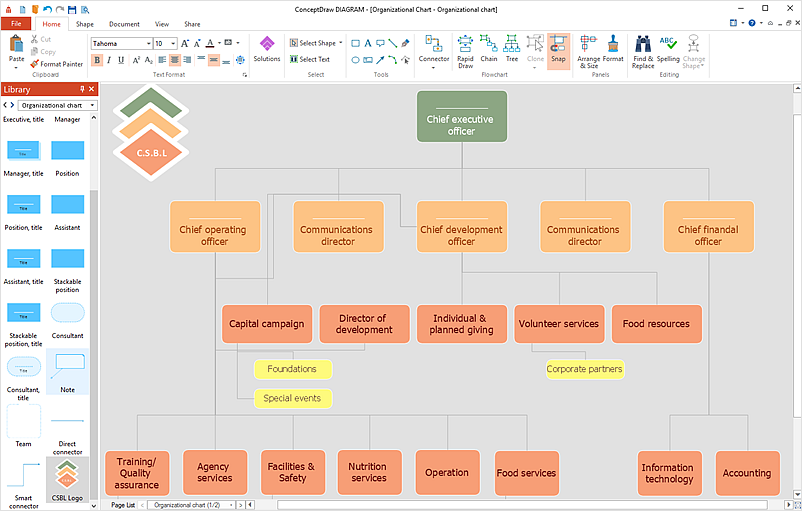
One of the key elements of ConceptDraw DIAGRAM solutions are the libraries, containing a set of associated objects. Using these collections of business oriented vector objects, you can quickly get started making the diagram in the theme you need. The library collection can be supplemented by creating new or editing existing objects. You can create your own unique library just by dragging objects with the mouse. Library objects can be customized and saved for later use. You can change the scaling, color, line weight, label, and even the fill pattern of an object to use in custom drawings and diagrams. Your custom objects even can be searched for the next time you need to use them.HelpDesk
How to Create a Stakeholder Onion Diagram
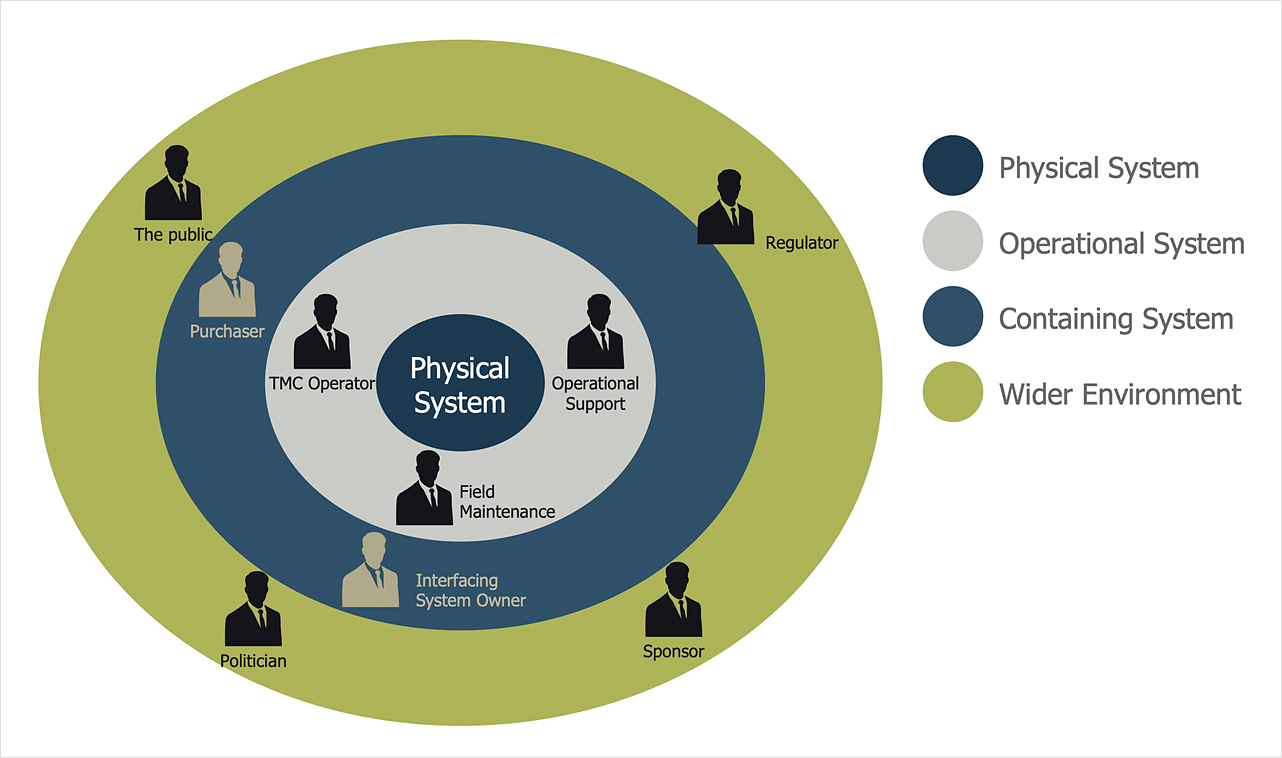
The Stakeholder Onion Diagram is stakeholder analysis tool from the arsenal of project management. It is used to display the relationships of stakeholders to a project goal. An Onion Diagram shows how stakeholder activities affect project results. The ConceptDraw Stakeholder Onion Diagram solution is intended to depict how the relationships that subsist in a project environment can influence on a project. A set of libraries and objects provided by this solution make short work of visualizing the stakeholder analysis of a project.- Data Flow Diagram Model | DFD - Model of small traditional ...
- Types of Flowcharts | Explain Different Type Of Process Oriented ...
- Process Oriented Flow Charts
- Gane Sarson Diagram | Data Flow Diagram Symbols. DFD Library ...
- Structured Systems Analysis and Design Method (SSADM) with ...
- Process Oriented Design Gane Sarson And Yourdon
- Process Oriented Design Gane
- Data Flow Diagram Symbols. DFD Library | Basic Flowchart ...
- Process Oriented Flowchart In System Analysis And Design
- Basic Flowchart Symbols and Meaning | Flowchart design ...
- UML Flowchart Symbols | Process Flowchart | Types of Flowchart ...
- Data Flow Diagram | Process Flowchart | Data Flow Diagram ...
- Database Flowchart Symbols | DFD Flowchart Symbols | Data Flow ...
- Process Flowchart | Basic Flowchart Symbols and Meaning ...
- Process Flowchart | Basic Flowchart Symbols and Meaning | Types ...
- How to Create a Data Flow Diagram using ConceptDraw PRO | Data ...
- DFD, Yourdon and Coad notation - Template
- Data Flow Diagram Symbols. DFD Library | Process Flowchart ...
- Basic Flowchart Symbols and Meaning | Accounting Information ...


