How To Implement Collaborative Project Management
Collaborative Project Management via Skype is an ideal tool for project teams who need to master a growing project complexity.
Communication Tool for Remote Project Management
Communication is the main challenge and the key success factor for remote project management. Communicating visually via Skype you bring all team and customers onto the one page. Remote Presentation for Skype solution for ConceptDraw MINDMAP helps communicate with remote team and customers in visual manner on wide range of issues. Using this solution for regular status meetings allows you to push your team on tasks and keep task statuses up to date.How To Use Collaboration Tool in Project Management
Collaboration tool for project management enables you to give a new role to knowledge management and document sharing within your team.
How To Hold Project Collaboration via Skype
Project Management Trends. Status report presentation tool for remote teams, using Skype to collaborate on project objectives.
 Business and Finance
Use Business and Finance solution to make professional-looking documents, presentations and websites, business, finance, advertising, and project management illustrations, or any designs that requires clipart of currency, office, business, advertising, management, marketing, people, time, post, contacts, collaboration, etc.
Pyramid Diagram
The Project Management Triangle Diagram depicts three main constraints of any project: scope, time and cost. Projects have to comply with the specified scope, projects should be finished in time and projects need to consume the budget. Each of the constraints represents one side of the triangle, and any change in budget or timing or scope affects the entire diagram. This diagram was made using ConceptDraw Office suite including best marketing project management software extended with collection of tools for creative project management software and project management reporting software symbols.ConceptDraw PROJECT Software Overview
ConceptDraw PROJECT is an effective tool for new and experienced users with a fine balance of usability and powerful functionality.Project management - Design Elements
These vector illustrations and cliparts are created using ConceptDraw DIAGRAM for drawing the Project management Illustrations and contain plenty of project management design elements. The clipart library Project management includes 35 icons. This symbols used by the best marketing project management software, typically by project management reporting software for presentation on project status and results.How To Create Project Report
ConceptDraw PROJECT contains an extensive tool set to help project managers. The rich data visualization capability that is provided by ConceptDraw products helps you create project dashboards, one-click reports, multi-project views, Gantt charts, and resource views. Let′s learn how to get maximum value using ConceptDraw PROJECT!How To Show Project Progress Peport on Web
Project progress on web: delivering project status to remote teams and stakeholders via Skype.
Gantt chart examples
All Gantt charts were made using ConceptDraw PROJECT. ConceptDraw PROJECT works both on Windows and Mac OS X. It allows to schedule a voluntary number of projects in a single Workspace document and lets easily share tasks and resources among them. ConceptDraw PROJECT shares files among Windows and Mac OS X.One formula of professional mind mapping : input data + output data + make great presentation
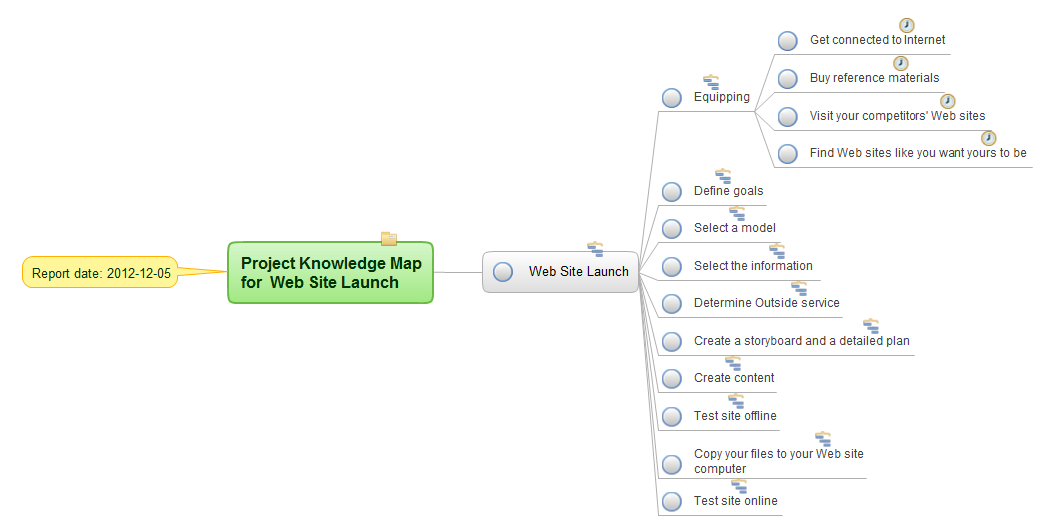
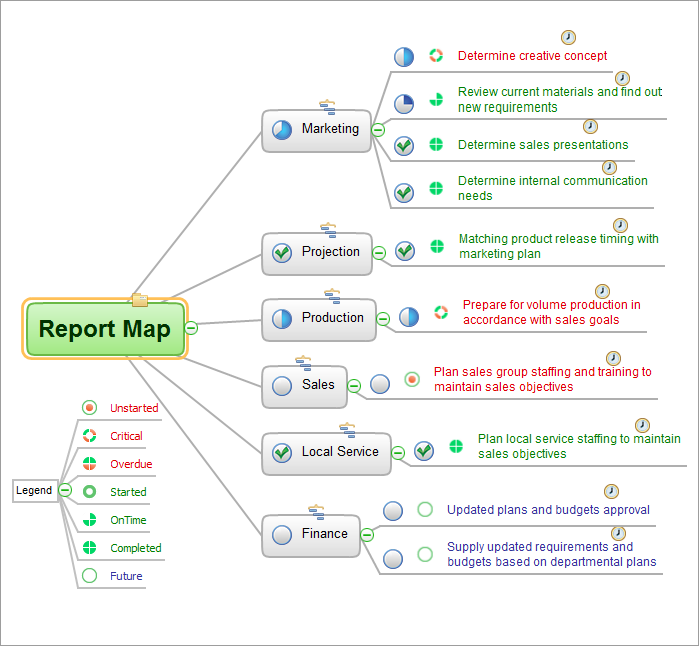
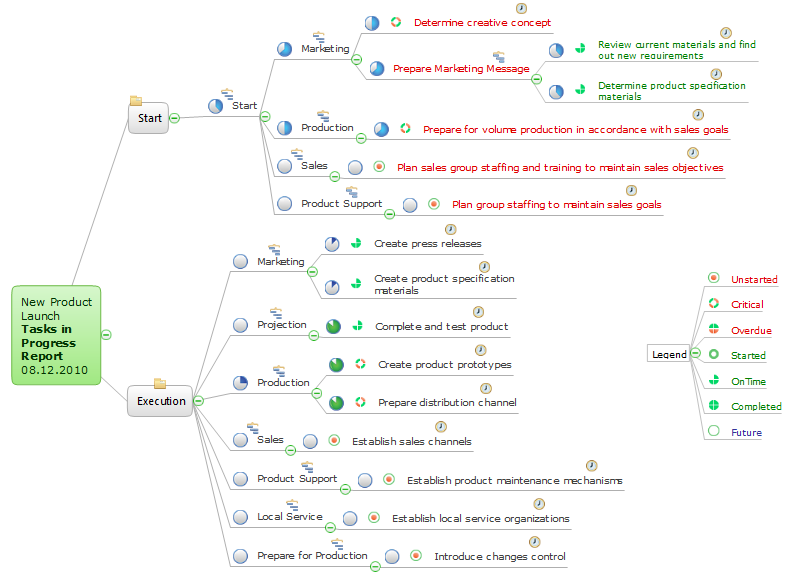
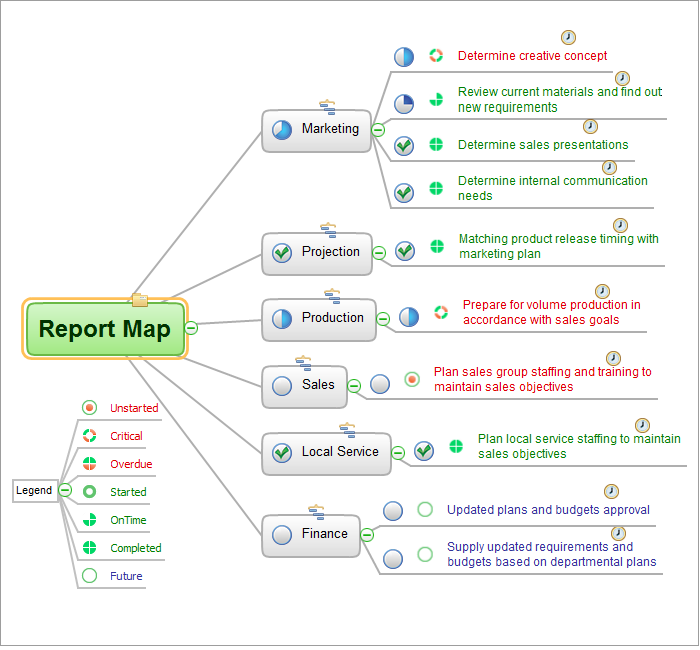
ConceptDraw MINDMAP is a powerful software from ConceptDraw Office suite, which provides a lot of tools and components for professional Mind Mapping. Besides the extensive tools for creation attractive and great-looking Mind Maps, it offers also wide import capabilities from MS Office files and mind mapping files MindJet MindManager, XMind and FreeMind, extensive export capabilities to common formats, such as PDF, HTML, different graphic formats, the possibility to generate MS Office documents, Project Management reports, PowerPoint presentations and demonstrate them via Skype conference call. Use of Skype conference call feature lets you to demonstrate the presentation's slide show and control it on computers of Skype call participants. This Report Mind Map example created in ConceptDraw MINDMAP software depicts the current project status and includes many pages and slides. This Project Status Report can be easy played as a slide show presentation on the large screen or to remote team using Skype conference call.CORRECTIVE ACTIONS PLANNING. PERT Chart
The PERT Chart is constructed as part of the process in creating a schedule of corrective actions. The PERT Chart shows the logical connections and consequence of tasks to be performed. It displays the time period for problem solving and the implementation of all activities through the critical path. ConceptDraw Office suite is a software for corrective actions planning.
Software Work Flow Process in Project Management with Diagram
This sample was created in ConceptDraw DIAGRAM diagramming and vector drawing software using the Workflow Diagrams Solution from the Software Development area of ConceptDraw Solution Park.This sample shows the Workflow Diagram that clearly illustrates stages a BPM consists of and relations between all parts of business. The Workflow Diagrams are used to represent the transferring of data during the work process, to study and analysis the working processes, and to optimize a workflow.
SWOT Sample in Computers
SWOT analysis is an effective method of making the plan for evaluation the Strengths, Weaknesses, Opportunities, and Threats that are involved in a project. It is actively applied in business sphere and helps define the objective of the project. It lets detect and represent the external and internal causes for the accomplishing the project goals and business purposes, and also plays important role in formation successful and perspective business. ConceptDraw DIAGRAM is a perfect diagramming software which nicely suits for SWOT analysis and representation its results in the form of SWOT diagrams of different complexity and design, thanks to the included SWOT and TOWS Matrix Diagrams solution from Management area of ConceptDraw Solution Park. This solution contains a lot of specially designed SWOT templates, SWOT matrix samples (SWOT analysis sample, SWOT sample in computers, SWOT matrix for business sphere, SWOT matrix educational, and many others), and also ready SWOT matrix objects that allow users create their own SWOT diagrams in minutes.Program to Make Flow Chart
Use ConceptDraw DIAGRAM diagramming and business graphics software for drawing your own PM life cycle flow charts.Swot Analysis Examples
SWOT analysis is an advanced plan making methodology for detection the Strengths and Weaknesses, Opportunities and Threats, that are involved in a project. SWOT analysis possesses a wide variety of real and potential applications and is a key part of any business planning and analysis. SWOT analysis uses as a visual tool the SWOT diagrams and SWOT matrices. ConceptDraw DIAGRAM software with SWOT and TOWS Matrix Diagrams solution provides a lot of SWOT analysis examples and samples, and also numerous collection of built-in SWOT templates, which will be the good start in your self-depending drawing and the perfect source of inspiration. You can always start to design your SWOT diagrams from the blank sheet using the included predesigned vector objects, but in many cases to save the time and efforts for SWOT diagramming would be preferable to use the ready example the most appropriate to your needs. Customizing the proposed SWOT diagrams you will achieve a great success in drawing SWOT matrices of any style and complexity.UML Sample Project
Unified Modeling Language (UML) is a graphical modeling language for describing, visualizing, projecting and documenting of object oriented systems. UML digram is used for modeling of organizations and their business processes, for development the big projects, the complex software applications. Comprehensive UML diagram allows to create the set of interrelated documents that gives the complete visual representation of the modeling system.Business and Finance Illustrations Example
ConceptDraw Business Finance Illustration examples and libraries contain vector clip art for drawing different Business and Finance Illustrations. You may find Advertising example, Project Management example, Business Model example and many more.- How To Implement Collaborative Project Management | How To Use ...
- CORRECTIVE ACTIONS PLANNING PERT Chart | How To ...
- Value stream map example | Timeline Diagrams | Communication ...
- Gant Chart in Project Management | Gantt charts for planning and ...
- Communication Tool for Remote Project Management | Timeline ...
- Gantt chart examples | Gant Chart in Project Management | What ...
- How To Implement Collaborative Project Management ...
- Communication Tool for Remote Project Management | How To ...
- Audit flowchart - Project management process | PM Presentations ...
- Communication Tool for Remote Project Management | Business ...
- How To Implement Collaborative Project Management ...
- Value stream map example | Marketing | Management |
- Status Dashboard | PM Dashboards | Project management task ...
- Gant Chart in Project Management | Gantt chart examples | What ...
- Communication Tool for Remote Project Management | Project ...
- Timeline Diagrams | Communication Tool for Remote Project ...
- Software Work Flow Process in Project Management with Diagram ...
- Gantt charts for planning and scheduling projects | Gant Chart in ...
- Gant Chart in Project Management | Gantt charts for planning and ...
- Audit flowchart - Project management process | Program to Make ...


