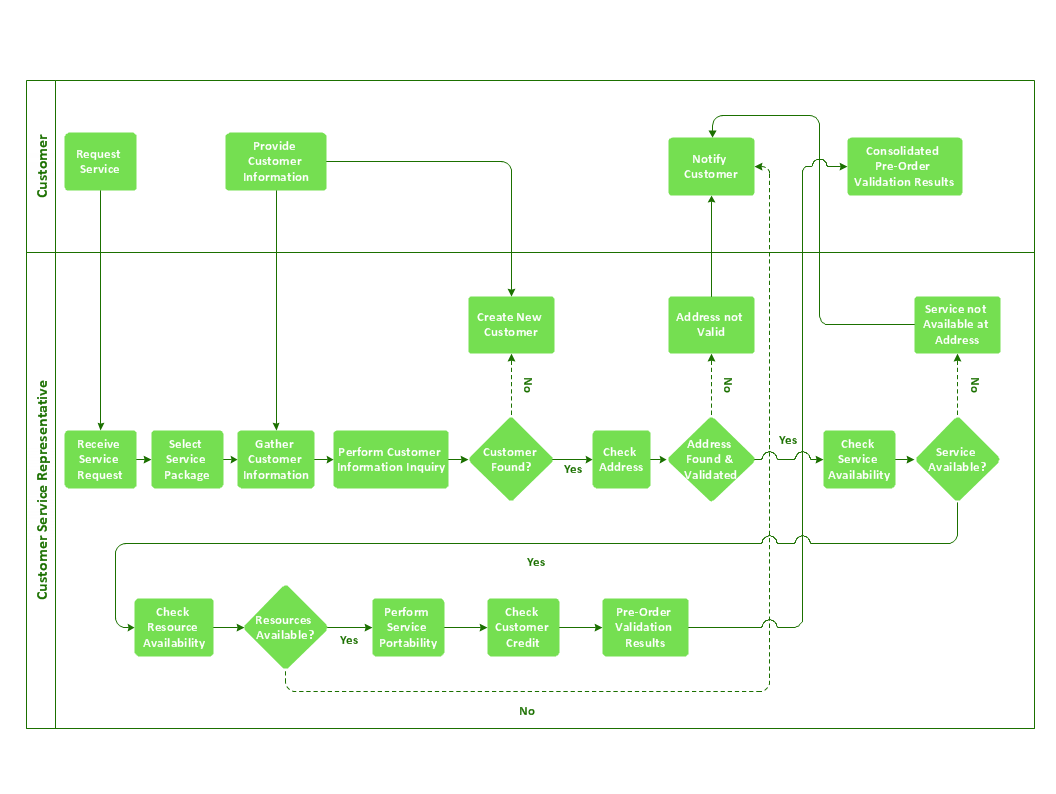
Vertical Cross Functional Flowchart

Powerful Drawing Feature for Creating Professional Diagrams

MS Visio Look a Like Diagrams

ConceptDraw Arrows10 Technology
How To Create Professional Diagrams
Professional Diagram and Flowchart Software

Applications

Cross-Functional Flowchart - The easiest way to draw crossfunctional

Diagram Software - The Best Choice for Diagramming

Cross-Functional Flowchart Basics
Software development with ConceptDraw DIAGRAM

- Simple & Fast Diagram Software | Management Tools Total ...
- Types of Flowchart - Overview | Process Flowchart | Flow Diagram ...
- Simple & Fast Diagram Software | How to Draw an Organization ...
- Total Quality Management Business Diagram | Business Process ...
- Matrices | Seven Management and Planning Tools | Feature ...
- Business Productivity Area | PM Presentations | TQM Diagram ...
- Definition TQM Diagram | Total Quality Management Definition ...
- Gant Chart in Project Management | What Constitutes a Project ...
- SWOT Analysis Solution - Strategy Tools | Development of software ...
- Business Process Diagram | Business Process Modeling with ...
- Business Productivity Area | Business Process Modeling Software ...
- How to Draw an Organization Chart | Social Media Response ...
- Social strategy pyramid - Marketing diagram | SWOT Analysis ...
- Marketing | Marketing Diagrams | Block Diagrams |
- Marketing | SWOT Analysis Solution - Strategy Tools | Pyramid Chart ...
- Marketing | Boston growth-share matrix template | Business ...
- Management | Total Quality Management Business Diagram | Total ...
- Build Strategies Exchanging Mind Maps with Evernote | Remote ...
- How to Draw an Organization Chart | Management | Identifying ...
- Pyramid Chart Examples | How to Draw an Organization Chart ...