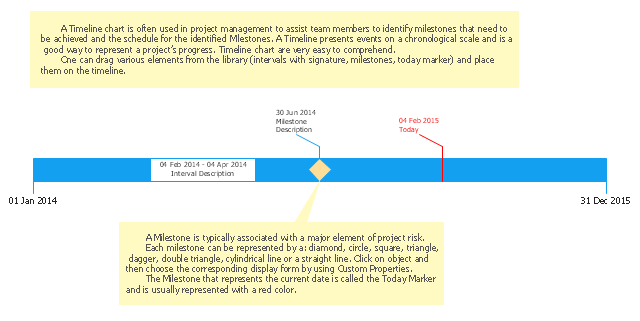
Timeline charts presents events and time periods on a chronological scale. They are used in project management to visualize project milestones and upper level phases, and show project progress.
"Time is one of the most critical resources in any project. Good planning spreads the necessary work over a reasonable period of time. This allows everyone to work at a consistent, sustainable pace. Poor planning leaves people stuck and idle, then forces them to scramble to catch up later on. While it does take time to plan ahead, the time ... saved more than make up for it. Good planning is a part of good doing. ...
A Timeline is a clean and concise visual representation of a series of events. It helps you to arrange large chunks of time and see the overall plan easily." [education.rec.ri.cmu.edu/ previews/ nxt_ products/ robotics_ eng_ vol_ 2/ preview/ content/ timeline.pdf]
This timeline template for the ConceptDraw PRO diagramming and vector drawing software is included in the Timeline Diagrams solution from the Management area of ConceptDraw Solution Park.
Timeline template
Business diagrams & Org Charts with ConceptDraw DIAGRAM


 Timeline Diagrams
Timeline Diagrams solution extends ConceptDraw DIAGRAM diagramming software with samples, templates and libraries of specially developed smart vector design elements of timeline bars, time intervals, milestones, events, today marker, legend, and many other elements with custom properties, helpful for professional drawing clear and intuitive Timeline Diagrams. Use it to design simple Timeline Diagrams and designate only the main project stages, or highly detailed Timeline Diagrams depicting all project tasks, subtasks, milestones, deadlines, responsible persons and other description information, ideal for applying in presentations, reports, education materials, and other documentation.
Gantt Chart Software

How to Report Task's Execution with Gantt Chart

ConceptDraw DIAGRAM The best Business Drawing Software

 Management
This solution extends ConceptDraw DIAGRAM and ConceptDraw MINDMAP with Management Diagrams and Mind Maps (decision making, scheduling, thinking ideas, problem solving, business planning, company organizing, SWOT analysis, preparing and holding meetings
Examples of Flowcharts, Org Charts and More


 Quality
This solution extends ConceptDraw DIAGRAM and ConceptDraw MINDMAP with Quality Management Diagrams (Total Quality Management Diagrams, Timelines, Workflows, Value Stream Maps) and Mind Maps (Presentations, Meeting Agendas, Problem to be solved).
Communication Tool for Remote Project Management

How to Create Gantt Chart

 Data Flow Diagrams (DFD)
Data Flow Diagrams solution extends ConceptDraw DIAGRAM software with templates, samples and libraries of vector stencils for drawing the data flow diagrams (DFD).
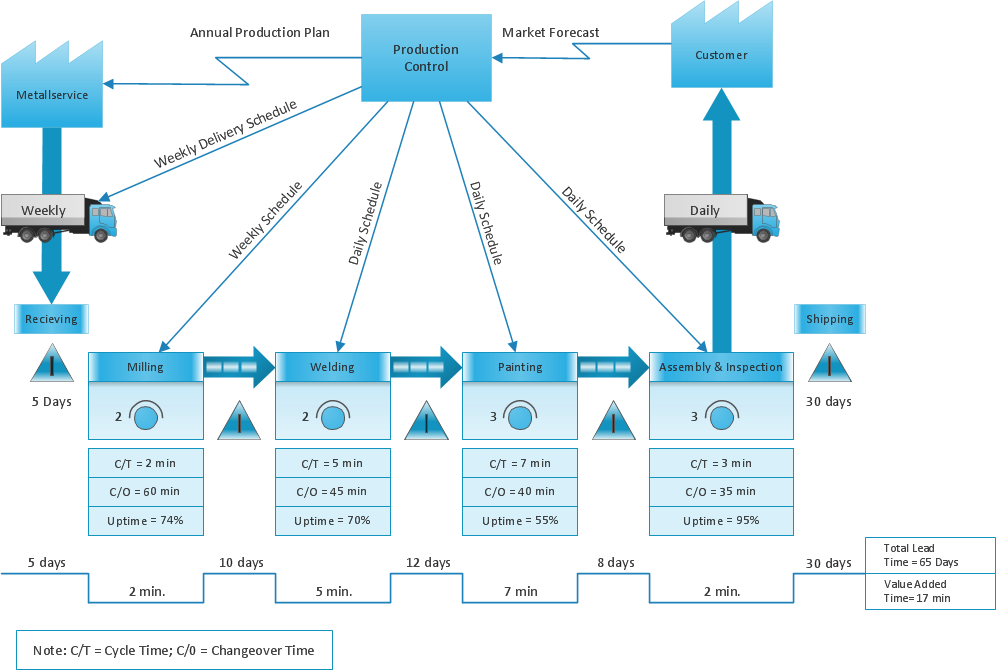
Create a Value Stream Map
 Seven Management and Planning Tools
Seven Management and Planning Tools solution extends ConceptDraw DIAGRAM and ConceptDraw MINDMAP with features, templates, samples and libraries of vector stencils for drawing management mind maps and diagrams.
How To create Value Stream Map (VSM)

 Business Productivity Area
Business Productivity Solutions extend ConceptDraw products with tools for making presentations, conducting meetings, preparing documents, brainstorming, or building new strategies.
- Timeline Diagrams | Management | Marketing |
- Business Processes | Timeline Diagrams | Business diagrams & Org ...
- Project timeline diagram
- Project timeline - Request for proposal plan | PERT chart - Request ...
- Timeline Diagrams | Management | Business Processes |
- Communication Tool for Remote Project Management | Timeline ...
- Timeline diagram template | Timeline diagram | Project timeline ...
- Design elements - Timelines solution | Timeline diagram template ...
- Timeline Diagrams | Timeline diagram template | Timeline diagram ...
- Timeline Diagrams | Management | Marketing |
- Timeline Diagrams | Timeline diagram template | Project timeline ...
- Project timeline diagram - New business project plan | Timeline ...
- Value stream map example | Timeline Diagrams | Communication ...
- Timeline Diagrams | Project Assigning Resources | Project ...
- Total Quality Management TQM Diagrams | TQM Software Build ...
- Timeline Diagrams | Communication Tool for Remote Project ...
- Timeline Diagrams | Communication Tool for Remote Project ...
- Timeline Diagrams | Gantt Chart Software | How to Report Task's ...
- Gantt Chart Software | How to Report Task's Execution with Gantt ...
- Management | Marketing | ConceptDraw PRO The best Business ...