 Total Quality Management TQM Diagrams
Total Quality Management Diagrams solution extends ConceptDraw PRO software with samples, templates and vector stencils library for drawing the TQM flowcharts.
Organizational Structure Total Quality Management
The Total Quality Management Diagram solution helps you and your organization visualize business and industrial processes. Create Total Quality Management diagrams for business process with ConceptDraw software.Money - Design Elements
Set of vector cliparts, samples, templates and libraries helps you to create all sorts of new imagesthe for Money Illustrations. Various styles of money design elements (currency symbols, clipart, money symbols) can be found in ConceptDraw PRO Business and Finance Solution.Create TQM Flowcharts for Mac
The Total Quality Management Diagram solution helps your organization visualize business and industrial processes. Create Total Quality Management diagrams for business process with ConceptDraw software.
 Presentation Clipart
Presentation design elements solution extends ConceptDraw PRO software with slide samples, templates and vector stencils libraries with design elements of presentation symbols, arrows, callouts, backgrounds, borders and frames, title blocks.
Flow Chart for Olympic Sports
Sports Selection Flow Chart - This sample was created in ConceptDraw PRO using the Flowcharts Solution from the Marketing Area and shows the Flow Chart of sport selection. An experienced user spent 10 minutes creating this sample.A Creative Look at Quality Procedures
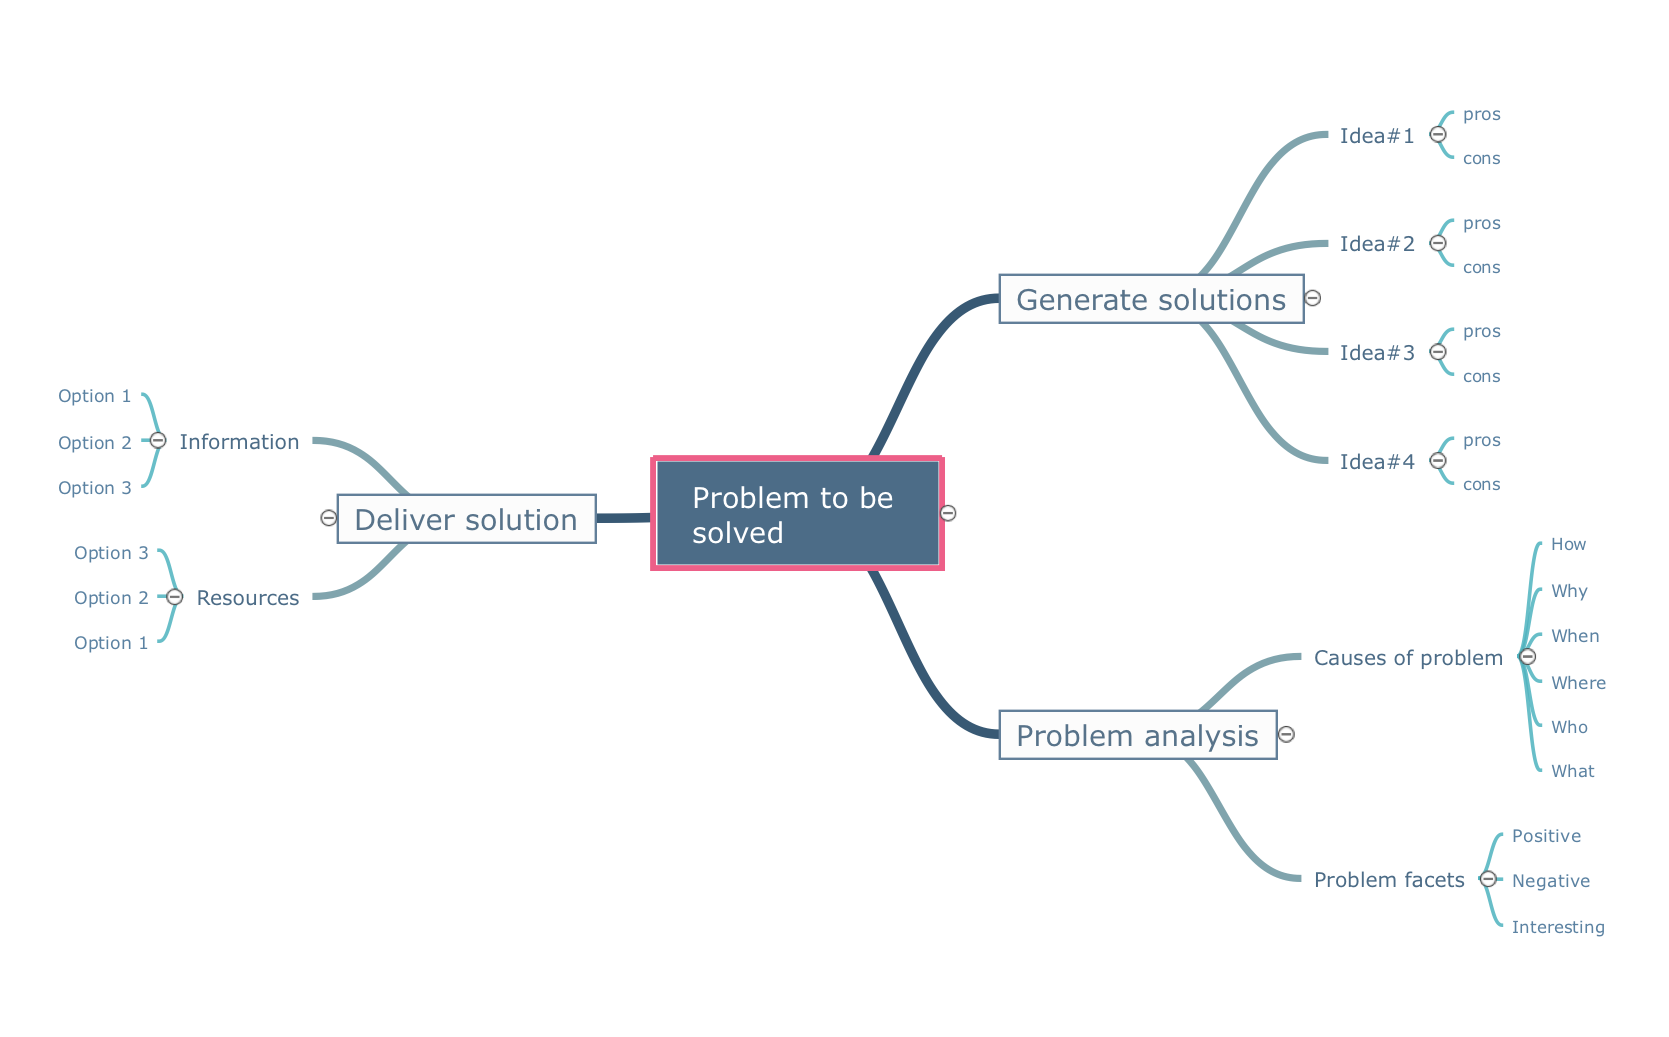
Get a creative look at a quality procedures with mindmaping software ConceptDraw MINDMAP. Mind maps can be of great value in depicting and describing a problem in detail, then structure it, and find the right decision.
 Holiday
The Holiday Solution from Illustration area of ConceptDraw Solution Park contains holiday illustration examples, templates and vector clipart library.
Improving Problem Solving and Focus with Fishbone Diagrams
When you need to focus on the problem, professional diagramming tool helps you create a Fishbone diagram also known as Ishikawa diagram. Understanding of the problem via Fishbone diagram will improve the processes between departments and teams. ConceptDraw PRO extended with Fishbone Diagrams solution gives a powerful tool for improving problem solving and focus with Fishbone diagrams.How to Build Cloud Computing Diagram Principal Cloud Manufacturing
The term “cloud” is very popular and widely used now, it is a server, data processing centre, or a network which lets to store the data and software, provides access to them, allows to run applications without installation and gives the possibility to process data hosted remotely via the Internet connection. For documenting the Cloud Computing Architecture with a goal to facilitate the communication between stakeholders are successfully used the Cloud Computing Architecture diagrams. It is convenient and easy to draw various Cloud Computing Architecture diagrams in ConceptDraw PRO software with help of tools of the Cloud Computing Diagrams Solution from the Computer and Networks Area of ConceptDraw Solution Park.
 Quality Mind Map
This solution extends ConceptDraw MINDMAP software with Quality Management Mind Maps (Presentations, Meeting Agendas, Problem to be solved).
 Aerospace and Transport
This solution extends ConceptDraw PRO software with templates, samples and library of vector clipart for drawing the Aerospace and Transport Illustrations. It contains clipart of aerospace objects and transportation vehicles, office buildings and anci
Lean Six Sigma Diagram Software
Lean Six Sigma (LSS) is a well-known in all over the world methodology of quality improvement and business perfection. ConceptDraw PRO diagramming and vector drawing software is a powerful Lean Six Sigma Diagram Software thanks to the included Value Stream Mapping solution from the Quality Area of ConceptDraw Solution Park.
 Artwork
Artwork solution extends ConceptDraw PRO software with illustration samples, templates and libraries of vector clipart of architecture, food, music, funny animals, aquatic fauna and transport.
 Seven Basic Tools of Quality
Manage quality control in the workplace, using fishbone diagrams, flowcharts, Pareto charts and histograms, provided by the Seven Basic Tools of Quality solution.
- Clip Art For Tqm
- TQM Diagram — Professional Total Quality Management | Quality ...
- Total Quality Management TQM Diagrams | Acid sulfate soil ...
- Total Quality Management Value | Fundamental Tool in Quality ...
- Total Quality Management TQM Diagrams | Visual Presentations ...
- Images Of Graphs Showing Total Quality Management
- Definition TQM Diagram | TQM Diagram — Professional Total ...
- Quality Management System | Presentation Clipart | Illustration ...
- Design elements - TQM diagram | Management Tools — Total ...
- Process Flowchart | Types of Flowchart - Overview | Total Quality ...
- Flow Chart for Olympic Sports | Total Quality Management Value ...
- Fundamental Tool in Quality Management | Quality management ...
- Process Flowchart | Total Quality Management Value ...
- Process Flowchart | Identifying Quality Management System ...
- Manufacturing and Maintenance | Organizational Structure Total ...
- Pyramid Diagram | Ansoff Matrix | Management Tools — Total ...
- Sales Dashboard | Total Quality Management TQM Diagrams ...
- Strategic Management Diagram
- 7 Tools For Quality Example


