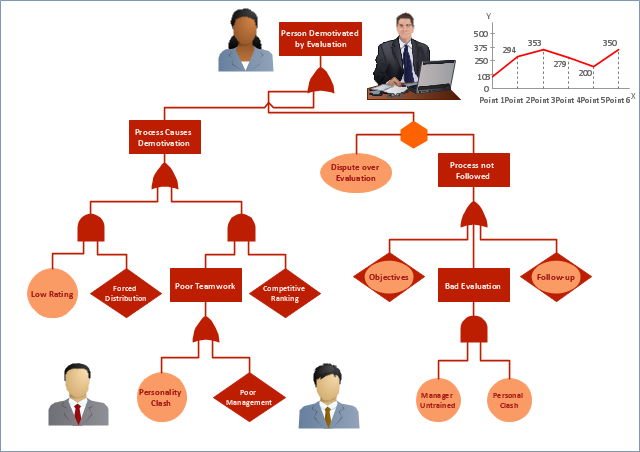
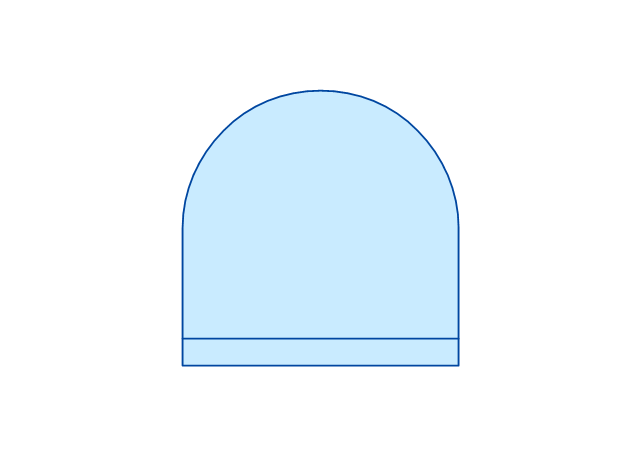
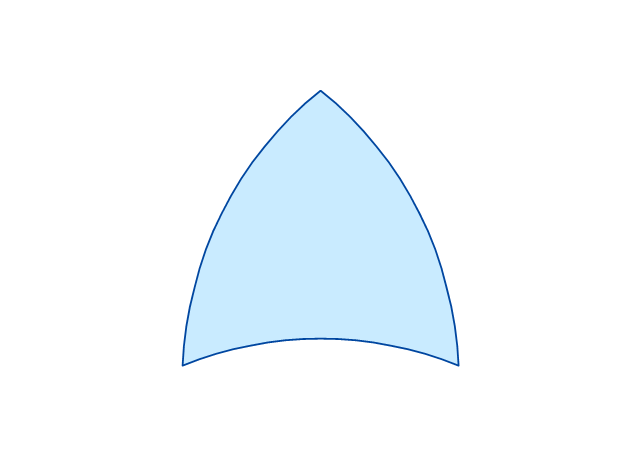
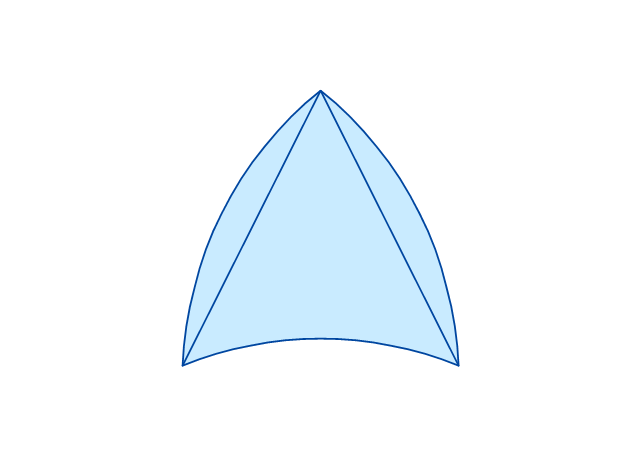
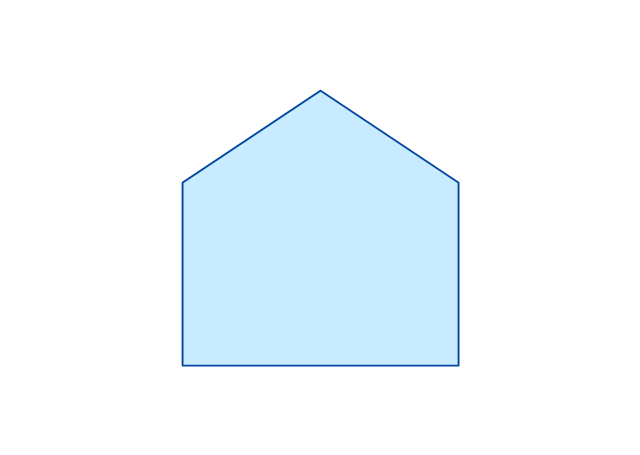
The vector stencils library "Fault tree analysis diagrams" contains 12 symbols for drawing Fault Tree Analysis (FTA) diagrams.
"Fault tree analysis (FTA) is a top down, deductive failure analysis in which an undesired state of a system is analyzed using Boolean logic to combine a series of lower-level events. This analysis method is mainly used in the fields of safety engineering and reliability engineering to understand how systems can fail, to identify the best ways to reduce risk or to determine (or get a feeling for) event rates of a safety accident or a particular system level (functional) failure. FTA is used in the aerospace, nuclear power, chemical and process, pharmaceutical, petrochemical and other high-hazard industries; but is also used in fields as diverse as risk factor identification relating to social service system failure.
In aerospace, the more general term "system Failure Condition" is used for the "undesired state" / Top event of the fault tree. These conditions are classified by the severity of their effects. The most severe conditions require the most extensive fault tree analysis. These "system Failure Conditions" and their classification are often previously determined in the functional Hazard analysis." [Fault tree analysis. Wikipedia]
The shapes example "Fault tree analysis diagrams" was created using the ConceptDraw PRO diagramming and vector drawing software extended with the Fault Tree Analysis Diagrams solution from the Engineering area of ConceptDraw Solution Park.
Fault tree analysis diagrams solution extends ConceptDraw PRO software with templates, samples and library of vector stencils for drawing the FTA diagrams.
Used Solutions
HelpDesk
How to Create a Fault Tree Analysis Diagram (FTD) in ConceptDraw PRO
Fault Tree Diagram are logic diagram that shows the state of an entire system in a relationship of the conditions of its elements. Fault Tree Diagram are used to analyze the probability of functional system failures and safety accidents. ConceptDraw PRO allows you to create professional Fault Tree Diagrams using the basic FTD symbols. An FTD visualize a model of the processes within a system that can lead to the unlikely event. A fault tree diagrams are created using standard logic symbols . The basic elements in a fault tree diagram are gates and events.ConceptDraw Arrows10 Technology
How should diagramming software work? The answer is - Fast and easy. "Tree"- mode drawing works like that. Just select objects in your drawing and press Tree or Chain button to connect all of them just in one click. Your diagram looks professional and it took only a moment to draw.The vector stencils library "Fault tree analysis diagrams" contains 12 symbols for drawing FTA diagrams in the ConceptDraw PRO diagramming and vector drawing software extended with the Fault Tree Analysis Diagrams solution from the Engineering area of ConceptDraw Solution Park.
www.conceptdraw.com/ solution-park/ engineering-fault-tree-analysis-diagrams
www.conceptdraw.com/ solution-park/ engineering-fault-tree-analysis-diagrams
The vector stencils library "Logical network diagram" contains 16 icon symbols.
Use these shapes for drawing logical computer network topology diagrams using the ConceptDraw PRO diagramming and vector drawing software.
The clipart example "Design elements - Logical network diagram" is included in the Computer and Networks solution from the Computer and Networks area of ConceptDraw Solution Park.
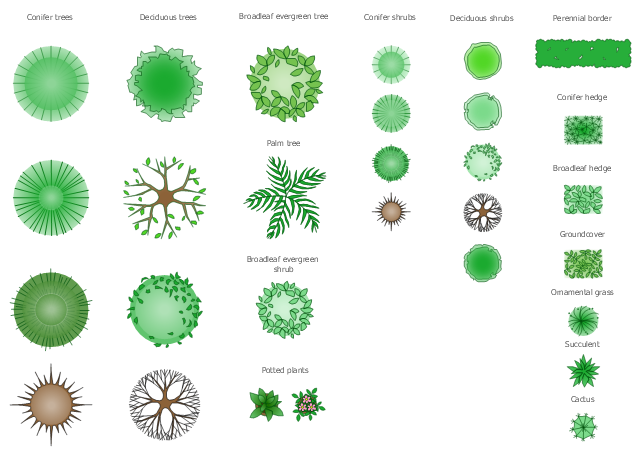
The design elements library Trees and plants contains 29 symbols of trees, hedges, groundcovers, greenery, and shrubbery.
"Landscape design is an independent profession and a design and art tradition, practised by landscape designers, combining nature and culture. In contemporary practice landscape design bridges between landscape architecture and garden design.
Landscape design focuses on both the integrated master landscape planning of a property and the specific garden design of landscape elements and plants within it." [Landscape design. Wikipedia]
Use the vector stencils library Trees and plants to draw the plans of landscape architecture, lawns, gardens, yards, parks planning, groundskeeping, landscape design, and arboretums using the ConceptDraw PRO diagramming and vector drawing software.
The shapes library Trees and plants is contained in the Site Plans solution from the Building Plans area of ConceptDraw PRO Solution Park.
 Fault Tree Analysis Diagrams
This solution extends ConceptDraw PRO v9.5 or later with templates, fault tree analysis example, samples and a library of vector design elements for drawing FTA diagrams (or negative analytical trees), cause and effect diagrams and fault tree diagrams.
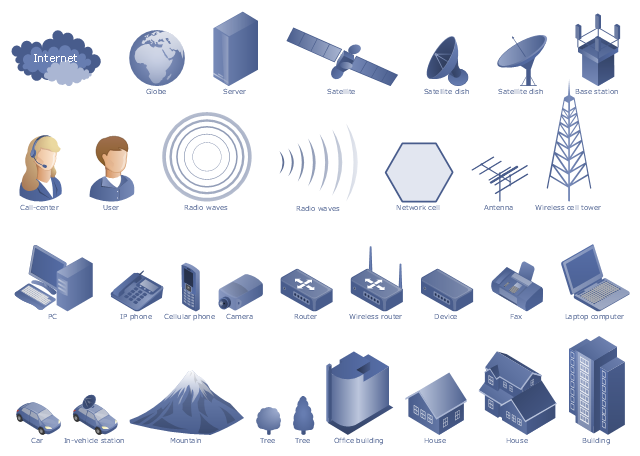
"A telecommunications network is a collection of terminal nodes, links and any intermediate nodes which are connected so as to enable telecommunication between the terminals. The transmission links connect the nodes together. The nodes use circuit switching, message switching or packet switching to pass the signal through the correct links and nodes to reach the correct destination terminal. Each terminal in the network usually has a unique address so messages or connections can be routed to the correct recipients. The collection of addresses in the network is called the address space. Examples of telecommunications networks are: computer networks, Internet, telephone network, global Telex network, aeronautical ACARS network." [Telecommunications network. Wikipedia]
The example "Design elements - Telecommunication networks" was created using the ConceptDraw PRO diagramming and vector drawing software extended with the Telecommunication Network Diagrams solution from the Computer and Networks area of ConceptDraw Solution Park.
The example "Design elements - Telecommunication networks" was created using the ConceptDraw PRO diagramming and vector drawing software extended with the Telecommunication Network Diagrams solution from the Computer and Networks area of ConceptDraw Solution Park.
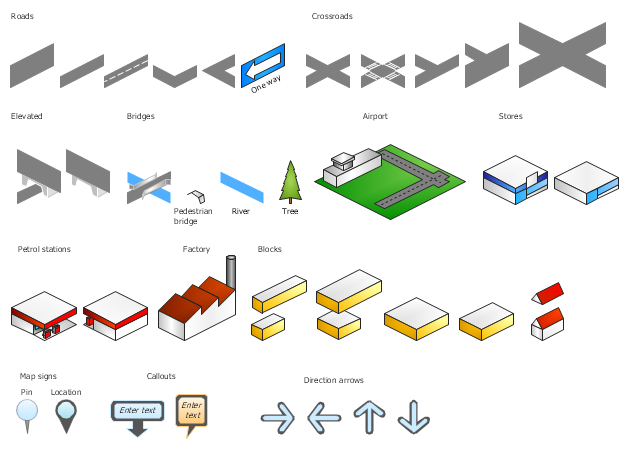
The vector stencils library "3D directional maps" contains 40 symbols for creating pictorial maps, street maps, locator maps, transit maps, tourist maps with points of interest (POI), road maps and route maps using the ConceptDraw PRO diagramming and vector drawing software.
"Pictorial maps are a category of maps that are also loosely called illustrated maps, panoramic maps, perspective maps, bird’s-eye view maps and Geopictorial maps amongst others. In contrast to the regular road map, Atlas or topographic cartography, pictorial maps depict a given territory with a more artistic rather than technical style. The cartography can be a sophisticated 3-D perspective landscape or a simple map graphic enlivened with illustrations of buildings, people and animals. They can feature all sorts of varied topics like historical events, legendary figures or local agricultural products and cover anything from an entire continent to a college campus. ...
Pictorial maps usually show an area as if viewed from above at an oblique angle. They are not generally drawn to scale in order to show street patterns, individual buildings, and major landscape features in perspective. While regular maps focus on the accurate rendition of distances, pictorial maps enhance landmarks and often incorporate a complex interplay of different scales into one image in order to give the viewer a more familiar sense of recognition." [Pictorial maps. Wikipedia]
The design elements library "3D directional maps" is included in the Directional Maps solution from the Maps area of ConceptDraw Solution Park.
- Decision Tree Symbols
- Decision Tree Symbols Basic
- Design elements - Trees and plants | Bubble diagrams in ...
- Landscape Architecture Plan Symbols And Trees
- Decision tree diagram | Basic Flowchart Symbols and Meaning ...
- Palm Tree Symbol For Landscaping
- Electrical Symbols — Logic Gate Diagram | How to Create a Fault ...
- Types of Flowcharts | Basic Flowchart Symbols and Meaning | Fault ...
- Tree Symbols For Site Analysis
- Electrical Drawing Software and Electrical Symbols | Electrical ...
- Broadleaf Evergreen Tree Symbols
- Wireframing | Wireframe Examples | Basic Flowchart Symbols and ...
- Basic Flowchart Symbols and Meaning | How to Create a Fault Tree ...
- Landscape Design Palm Tree Drawing
- Wireframing | Wireframe Examples | Basic Flowchart Symbols and ...
- Astronomy | Physics Symbols | Stars And Planets Tree Diagram
- Process Flowchart | Venn Diagrams | Physics Symbols | Math Tree ...
- Chemistry Symbols and Meanings | Process Flowchart | Fault Tree ...
- Physics Symbols | Astronomy | Presentation Exchange | Tree ...

