HelpDesk
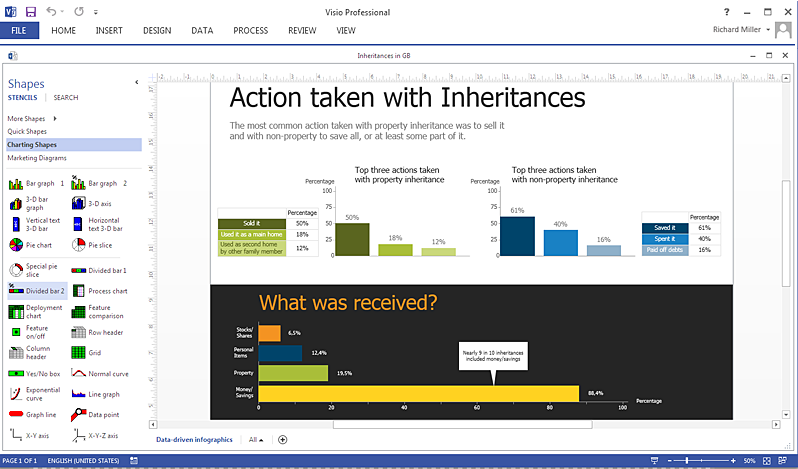
How To Create a MS Visio Data-driven Infographics Using ConceptDraw PRO
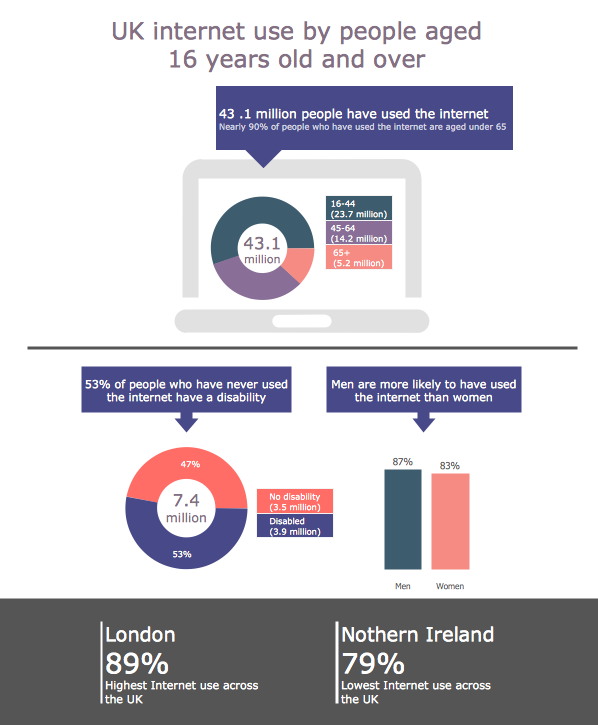
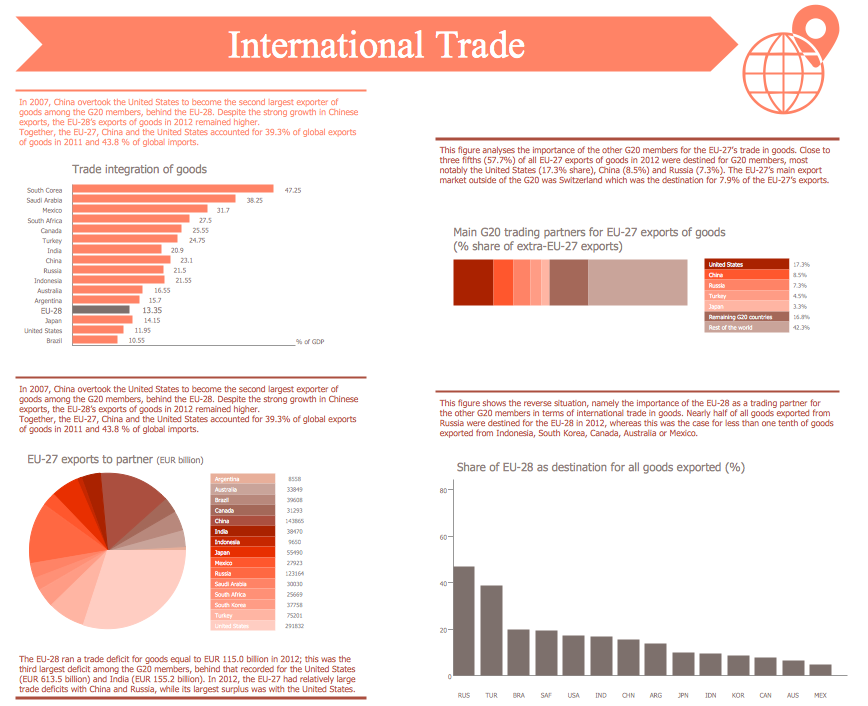
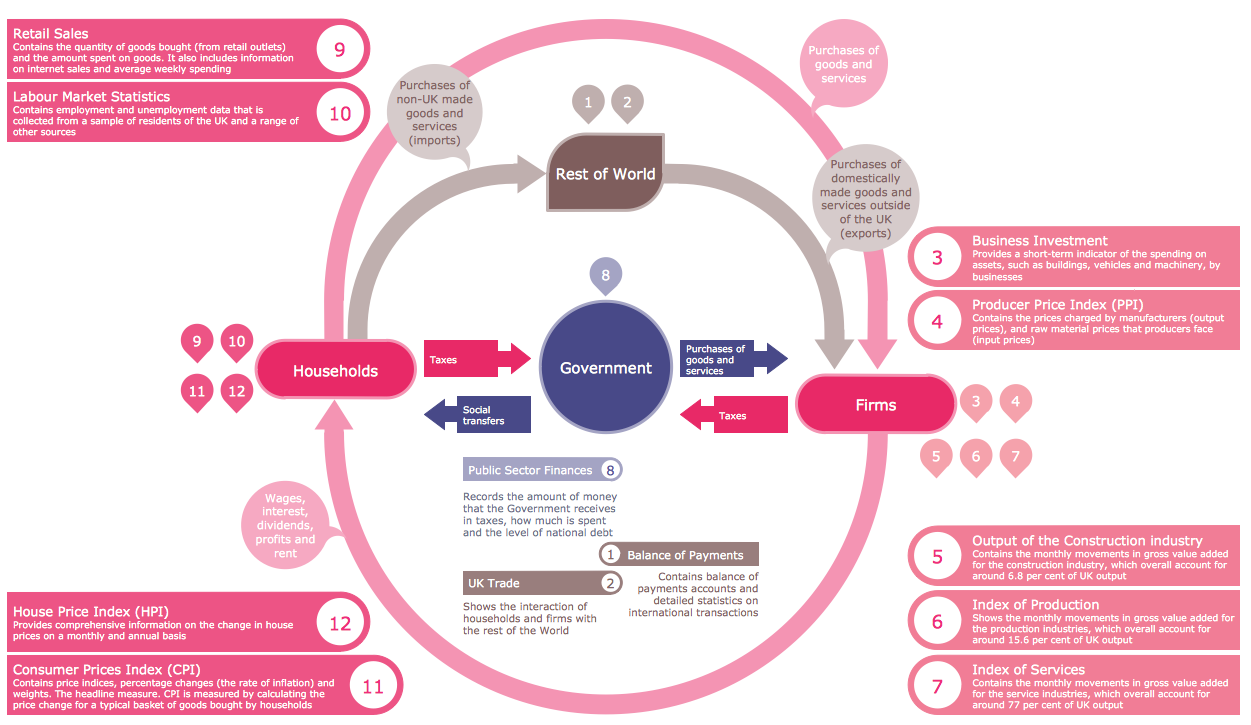
ConceptDraw PRO allows you to easily create data-driven infographics of any complexity and then make a MS Visio file from your diagram in a few simple steps.Infographic Tools
ConceptDraw PRO diagramming and vector drawing software offers the best infographic tools - Data-driven Infographics Solution from the “What are Infographics” Area of ConceptDraw Solution Park.Marketing Plan Infographic
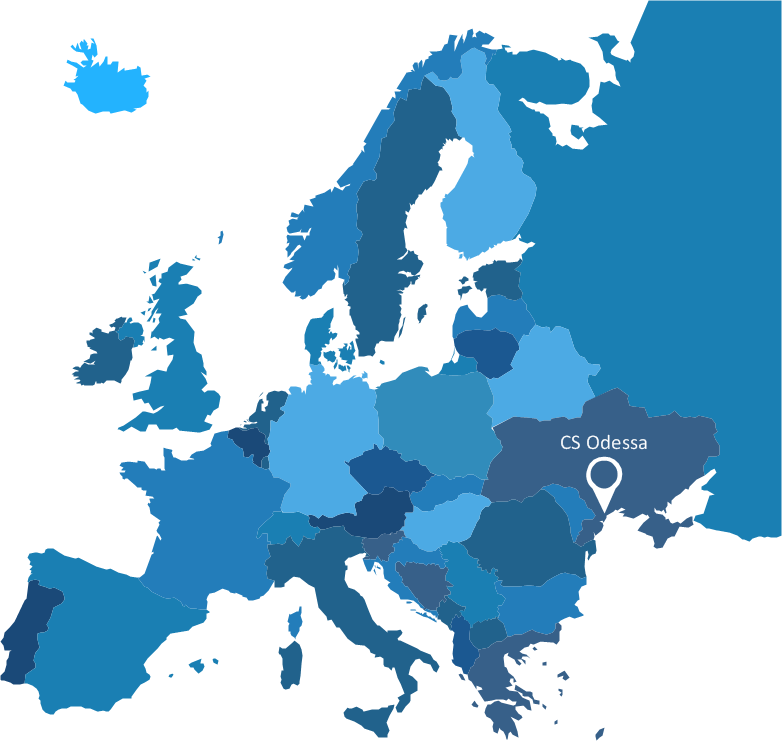
You need design the Marketing Plan Infographic and dream to find the useful tools to draw it easier, quickly and effectively? ConceptDraw PRO offers the unique Marketing Infographics Solution from the Business Infographics Area that will help you!Spatial infographics Design Elements: Continental Map
ConceptDraw PRO is a software for making infographics illustrations. You can work with various components to build really impressive and easy-to-understand infographics design.Infographic Maker
Infographic is a visual way of representing various information, data, knowledge in statistics, geography, journalism, education, and much more areas. ConceptDraw PRO supplied with Pictorial Infographics Solution from the “What are Infographics” Area, provides a set of powerful pictorial infographics tools. Thanks to them it is the best Infographic Maker.Content Marketing Infographics
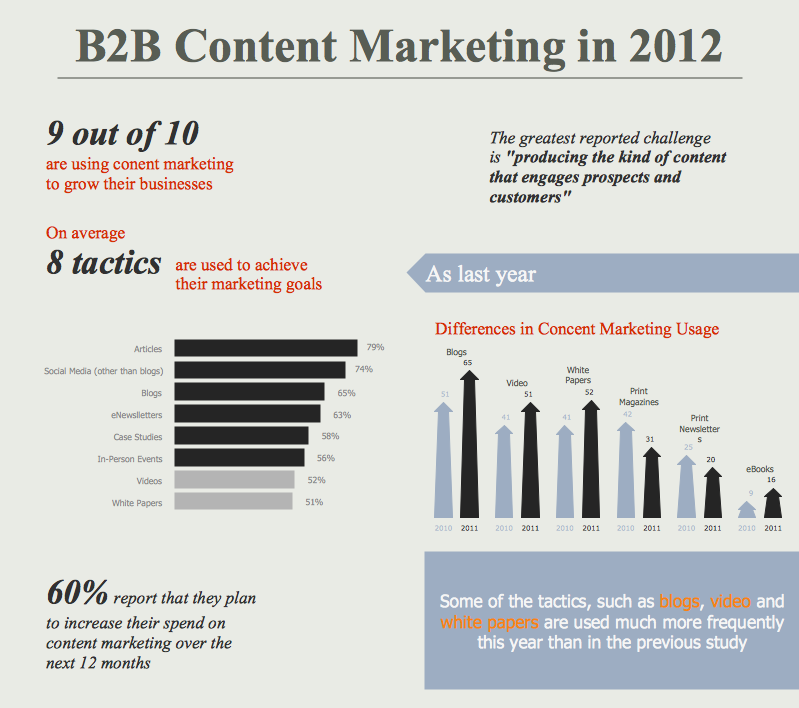
The popularity of visual content marketing grows day by day. So now simple and convenient designing of professional looking Content Marketing Infographics becomes increasingly actual. For achievement this goal ConceptDraw PRO software offers the Marketing Infographics Solution from the Business Infographics Area.Data Infographics
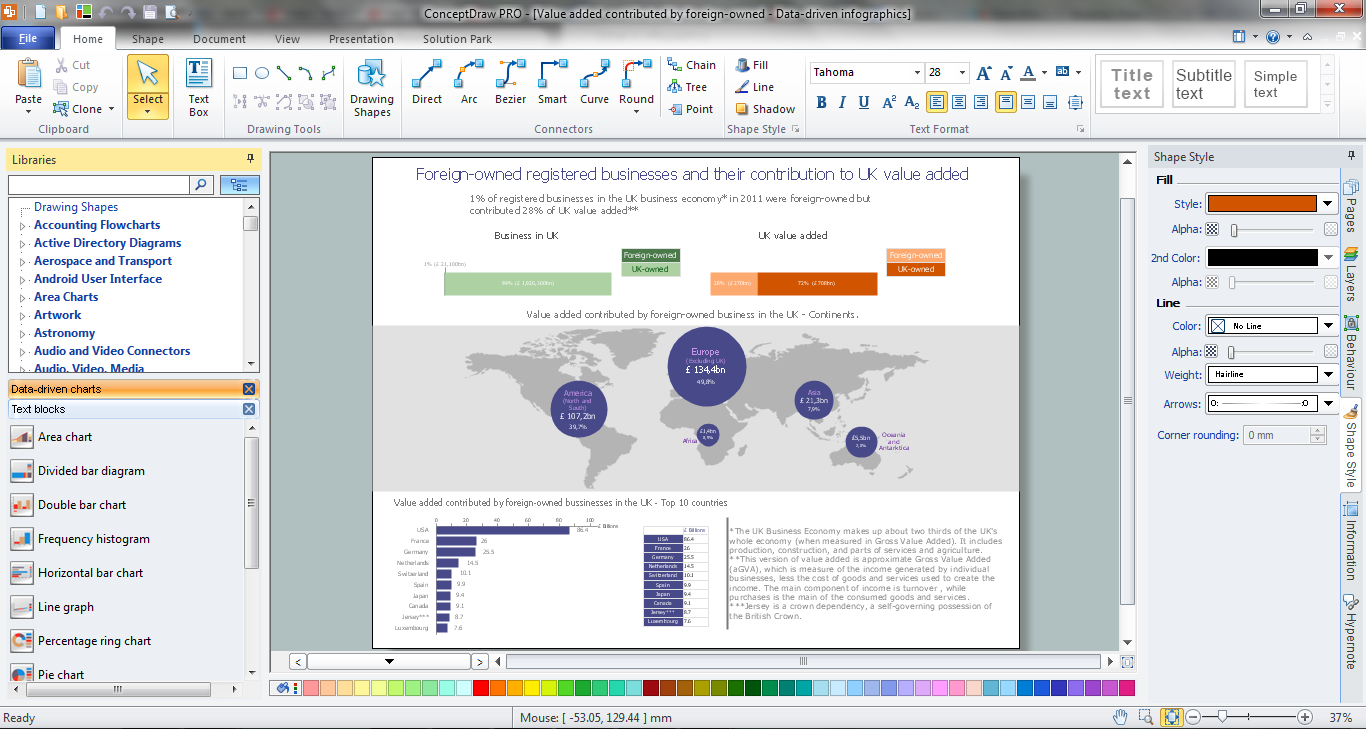
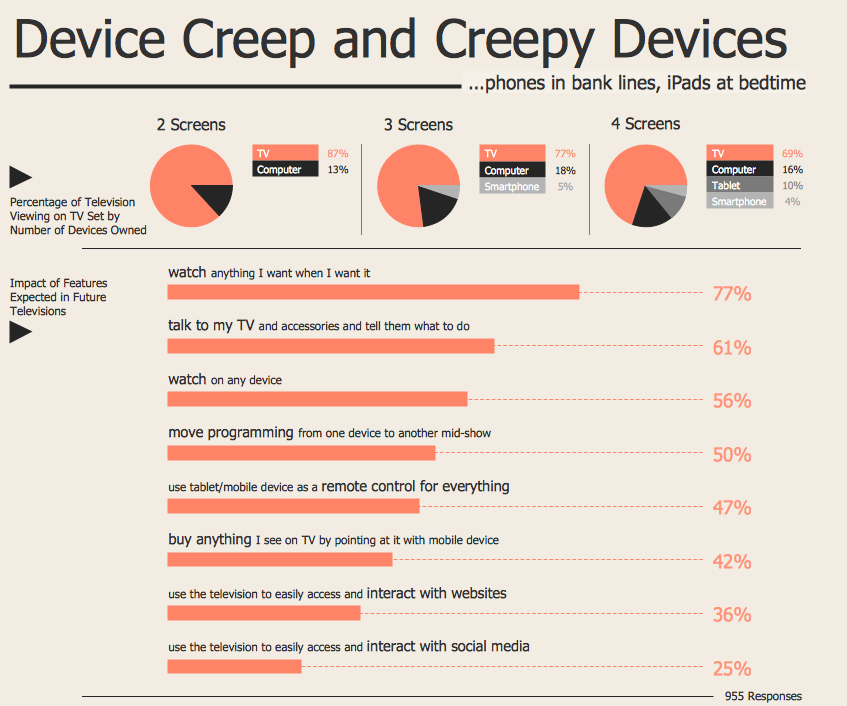
The popularity of visual Data Infographics grows day by day. So it would be nice to have effective software for their quick and easy creating. ConceptDraw PRO extended with Data-driven Infographics Solution from the “What are Infographics” Area of ConceptDraw Solution Park is exactly what you need.HelpDesk
Replace Your Current Diagramming Tool
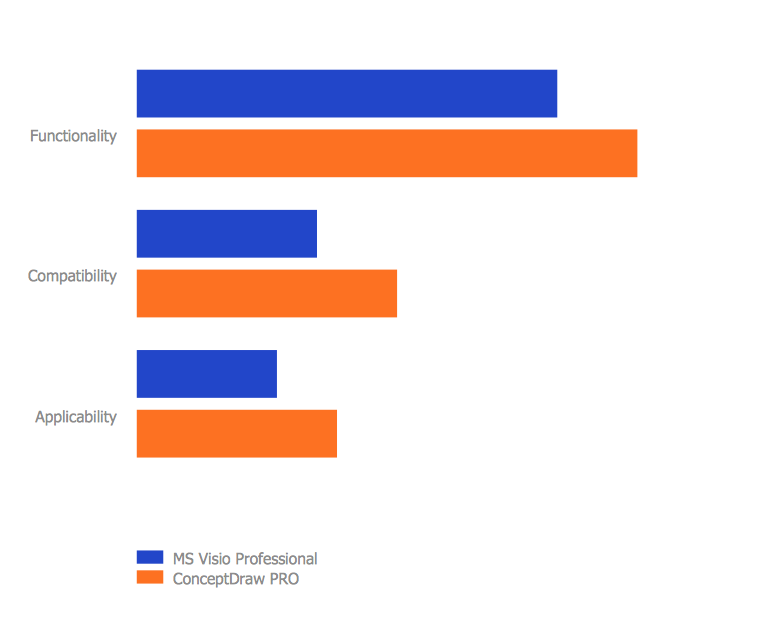
Migrate from Visio to ConceptDraw for the entire organization at super low price. By means of a ConceptDraw PRO Site License any employer in your company can get advantages of ConceptDraw PRO in just a $ 2995 per year. There is no need to count both licenses and users. Every co-worker in your organization will get permission to access at no extra charge. At half-price of Microsoft Visio®, you can supply your company with a ConceptDraw Site License. Reduced price and effortless administrating are just a couple of the causes to change Visio to ConceptDraw PRO. Here are just a few reasons.Education Infographics
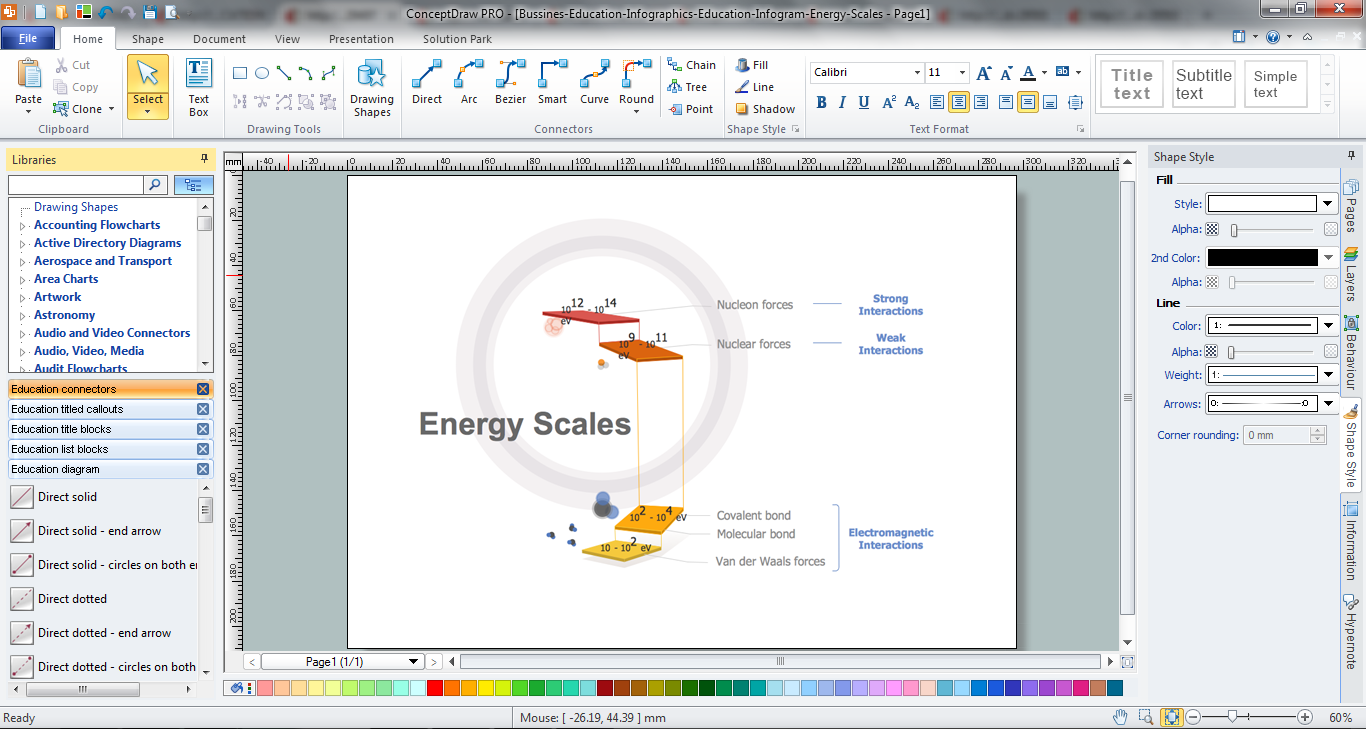
The Education Infographics are popular and effectively applied in the educational process. Now you don't need to be an artist to design colorful pictorial education infographics thanks to the unique drawing tools of Education Infographics Solution for ConceptDraw PRO diagramming and vector drawing software.Marketing Infographics
Marketing Infographics is a very popular tool that allows to represent the complex data, knowledge, and other marketing information in a simple, visual and attractive graphical form. But how to draw Marketing Infographics simply and quickly? ConceptDraw PRO diagramming and vector drawing software extended with unique Marketing Infographics Solution from the Business Infographics Area will help you design marketing infographics without efforts. This toolset included in ConceptDraw Office for small business project management, creating presentations using marketing infographics is critical part project management reporting software.Make an Infographic
You want to make an infographic and need the useful and convenient drawing tools for this? In this case the ConceptDraw PRO software extended with Education Infographics Solution is a real godsend for you.Typography Infographic Examples
ConceptDraw PRO extended with Typography Infographics Solution from the “What are Infographics” Area is a powerful infographic software that offers you variety of infographics examples. Use of predesigned examples as the base for your own Typography Infographics is a timesaving and useful way. Simply open the desired example, change for your needs and then successfully use it in any field of your activity.How to Make an Infographic
How to Make an Infographic quick and easy? The perfect way is to use the ConceptDraw PRO diagramming and vector drawing software extended with Education Infographics Solution from the Business Infographics Area.Internet Marketing Infographic
ConceptDraw PRO extended with Marketing Infographics Solution from the Business Infographics Area is the best software for creating Internet Marketing Infographic of any complexity in minutes. Make sure in it right now!- How To Create a MS Visio Data-driven Infographics Using ...
- Marketing Plan Infographic | How To Create a MS Visio Data-driven ...
- Education Infographics | Education Information | Educational ...
- How to draw Metro Map style infographics ? (New York) | Visio Files ...
- Marketing Plan Infographic | How To Create a MS Visio Data-driven ...
- How to Create Data-driven Infographics | How To Create a MS Visio ...
- Visio Infographic Stencil
- Spatial infographics Design Elements: Continental Map | Best Tool ...
- How to draw Metro Map style infographics ? Moscow, New York, Los ...
- Active Directory Diagram | How To Create a MS Visio Data-driven ...
- How to Create Data-driven Infographics | How to Add Data-driven ...
- How to draw Metro Map style infographics ? (London) | Geo Mapping ...
- Flowchart Software | Education Infographics | How to Purchase ...
- How to Open MS Visio ® 2013/2016 Files on a Mac® Using ...
- How to draw Metro Map style infographics ? (New York) | Map ...
- Internet Marketing Infographic | Internet solutions with ConceptDraw ...
- How To Convert Data-driven Infographics to Adobe PDF Using ...
- How to draw Metro Map style infographics ? (Los Angeles) | Network ...
- How to draw Metro Map style infographics ? Moscow, New York, Los ...
- Marketing Plan Infographic | Illustration | Network Layout Floor Plans ...
