Venn Diagram Examples for Problem Solving in Computer Science
Venn Diagram Problem Solving Example - Chomsky HierarchyVenn Diagram Problem Solving Examples in Quantum Information
Venn Diagram Problem Solving Example - BQP ComplexityWhat is UML Diagram
Representing subsystems, requirements, structural or behavioral patterns as well as logical or physical elements while modelling the system using the well known standard called Unified Modeling Language (UML) is better in a way of UML diagram and the best software for making it is ConceptDraw PRO one. Whether you want to create object, class (or package), use case, collaboration, sequence, component, state machine, timing, interaction overview, composite structure, activity or deployment UML diagram, you can always design them with help of our Solutions section on this site where you can find our samples for making any kind of flowcharts you need. Also you can find our examples and layouts in ConceptDraw STORE app which you can download as an application to the ConceptDraw PRO product as it can be much more useful, especially in terms of discovering this software for the first time. Working in finance, aerospace, banking, internet, healthcare or some other sphere of business, you will definitely find it helpful to use the UML as well as UML diagrams.Venn Diagram Problem Solving Examples
venn diagram problem solving example - human sustainability confluenceBar Diagrams for Problem Solving. Space Science
Vertical bar chart example - Composition of lunar soilWide area network (WAN) topology. Computer and Network Examples
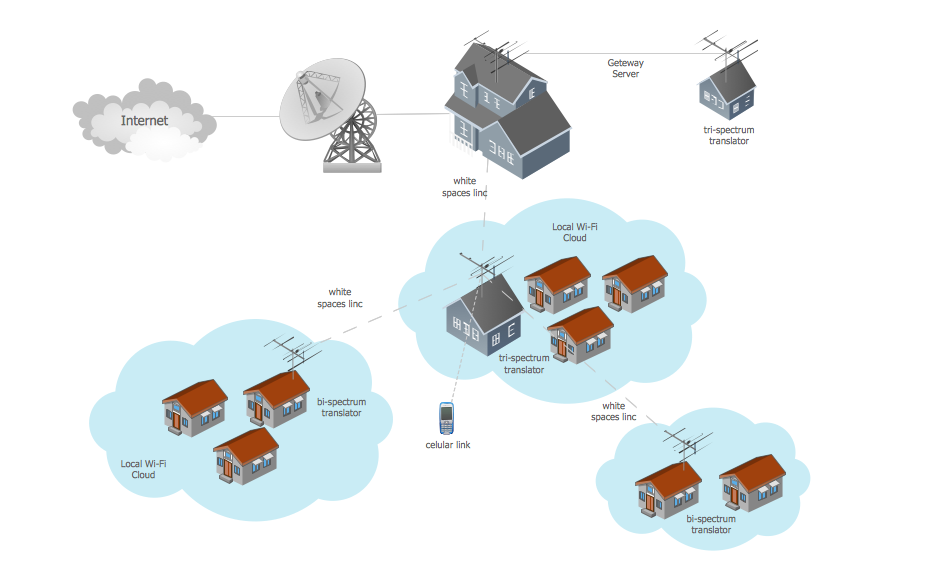
Wide area network (or WAN) is known as the special network for connecting telecommunications, such as computers, within one large geographical area. It usually contains some other, not as large, but smaller networks which can be LANs, MANs and other and includes circuit switching and packet switching technologies. Very well-known and common for using in different business structures as well as in governmental organizations, this topology can be illustrated with a help of truly unique and professional software - ConceptDraw PRO, which is the one offering large choice of many different design symbols and stencil elements for drawing many different flowcharts as well as charts, schemes, diagrams and plans in case you need to many any of mentioned structures in a short period of time using our libraries and templates, which were created in advance in order to simplify our users utilization of this truly unique application. Download it now to ensure yourself in making the right decision.Data Flow Diagram Example , Sample Data Fow Diagram
Working with lots of information analyzing it and arranging, it seems to be necessary to have software which can allow you to specify and range data, as well as illustrate data flow in a way of a diagram. Whether you need to display functional transforms, external entities, data flows, data storage as well as to control signals and transforms, you can always use diagram for such purpose and ConceptDraw PRO can help you to create it using also ConceptDraw STORE application full of libraries and examples of pre-designed charts which you can edit the way you need them to be and to look like in the very final form. Making your own flowcharts is simple using this product and to start with it would be enough to go to our Solutions section on this site to read about different kinds of schemes, flowcharts, diagrams and plans to find out how easy it is to use our software. Representing data flows, objects, processes and data storage with help of vector elements from the Object Library can be done during one day for the very beginner. Once you start today you’ll be so much better tomorrow and you’ll be able to use it making professionally looking charts in a few minutes only.Standard Flowchart Symbols and Their Usage. Basic Flowchart
Creating flowcharts use special objects to express what is needed to be presented or explained. Find Standard Flowchart Symbols as well as specific ones which can be used in different fields of activity showing the workflows in auditing, accounting, selling processes (to show the interaction between customer and sales company or an internal sales process), human resource management (displaying recruitment, payroll systems, hiring process and company’s development) and many more kinds of business in ConceptDraw PRO as well as Process Map, Business Process, and Education Flowcharts Symbols. Visualize your activities using various shapes connected with arrowed lines showing the process flow directions. Describe your business and technical processes as well as software algorithms using one of the best software for this purpose – ConceptDraw PRO. Feel free to use any symbol from the set of samples, and templates on Flowchart Solution which are also available in ConceptDraw STORE.- Diagrams In Science Examples
- Venn Diagram Examples for Problem Solving. Environmental Social ...
- Venn Diagram Examples for Problem Solving. Computer Science ...
- Fishbone Diagrams | Biology | Fishbone Science Example
- Venn Diagram Examples for Problem Solving. Computer Science ...
- Fishbone Diagram Science Examples In Science
- Venn Diagram Examples for Problem Solving. Computer Science ...
- Building Science Vector Diagram Example
- Chemistry | Biology | Physics | Example Of Solution In Science
- Systems engineering improvement | Venn Diagrams | Chemical and ...


