Project Dashboard
The dashboards created with the help of specialized tools of ConceptDraw PROJECT software are perfect for delivering a clear view about the project performance and progress to all project participants. ConceptDraw PROJECT allows generating three types of dashboard reports in ConceptDraw DIAGRAM document format, one of them is a Project Dashboard available for creation from the Dashboards section on the Reports toolbar. The Project Dashboard provides always relevant key information on the project and its current status on one report page. Therefore, it is helpful to define the future project's direction and the points that require the special management attention.
The Project Dashboard report document is visually divided into several parts, each of which displays defined data, such as general information about the project, the resources and tasks indicators, project complete indicator. All of them in their turn depict the percent ratios of late, early and on time tasks, also, the ratios of late tasks in progress and not started ones, along with the information about the actual project cost, the allocated budget, and resources allocation, and the values of numerous calculated Earned Value Schedule Indicators. They altogether form the complete project status overview. The data is represented in quantitative ratios and additionally the corresponding areas are visually highlighted with varied colors. The red color indicates some problems or the need of special attention, it is used to mark a late project, tasks or group of work resources; the yellow color shows a normal or on time status; the green color is used to demonstrate that some tasks, projects or resources are early or ahead of schedule. Besides, the Project Dashboard includes the links to additional graphical reports with more extensive information, which open on the separated pages when clicking on them. Pay attention to such important indicator as Cost and Budget, the color of bar indicates the project execution within a budget or signalizes the overrun of allocated budget. The lists of 25 most expensive tasks and overcosting tasks are available by links. The information about resources allocation in percent, with specifying the quantity of persons at the brackets, assists in timely correction and rational allocation the load between resources employed at your project.
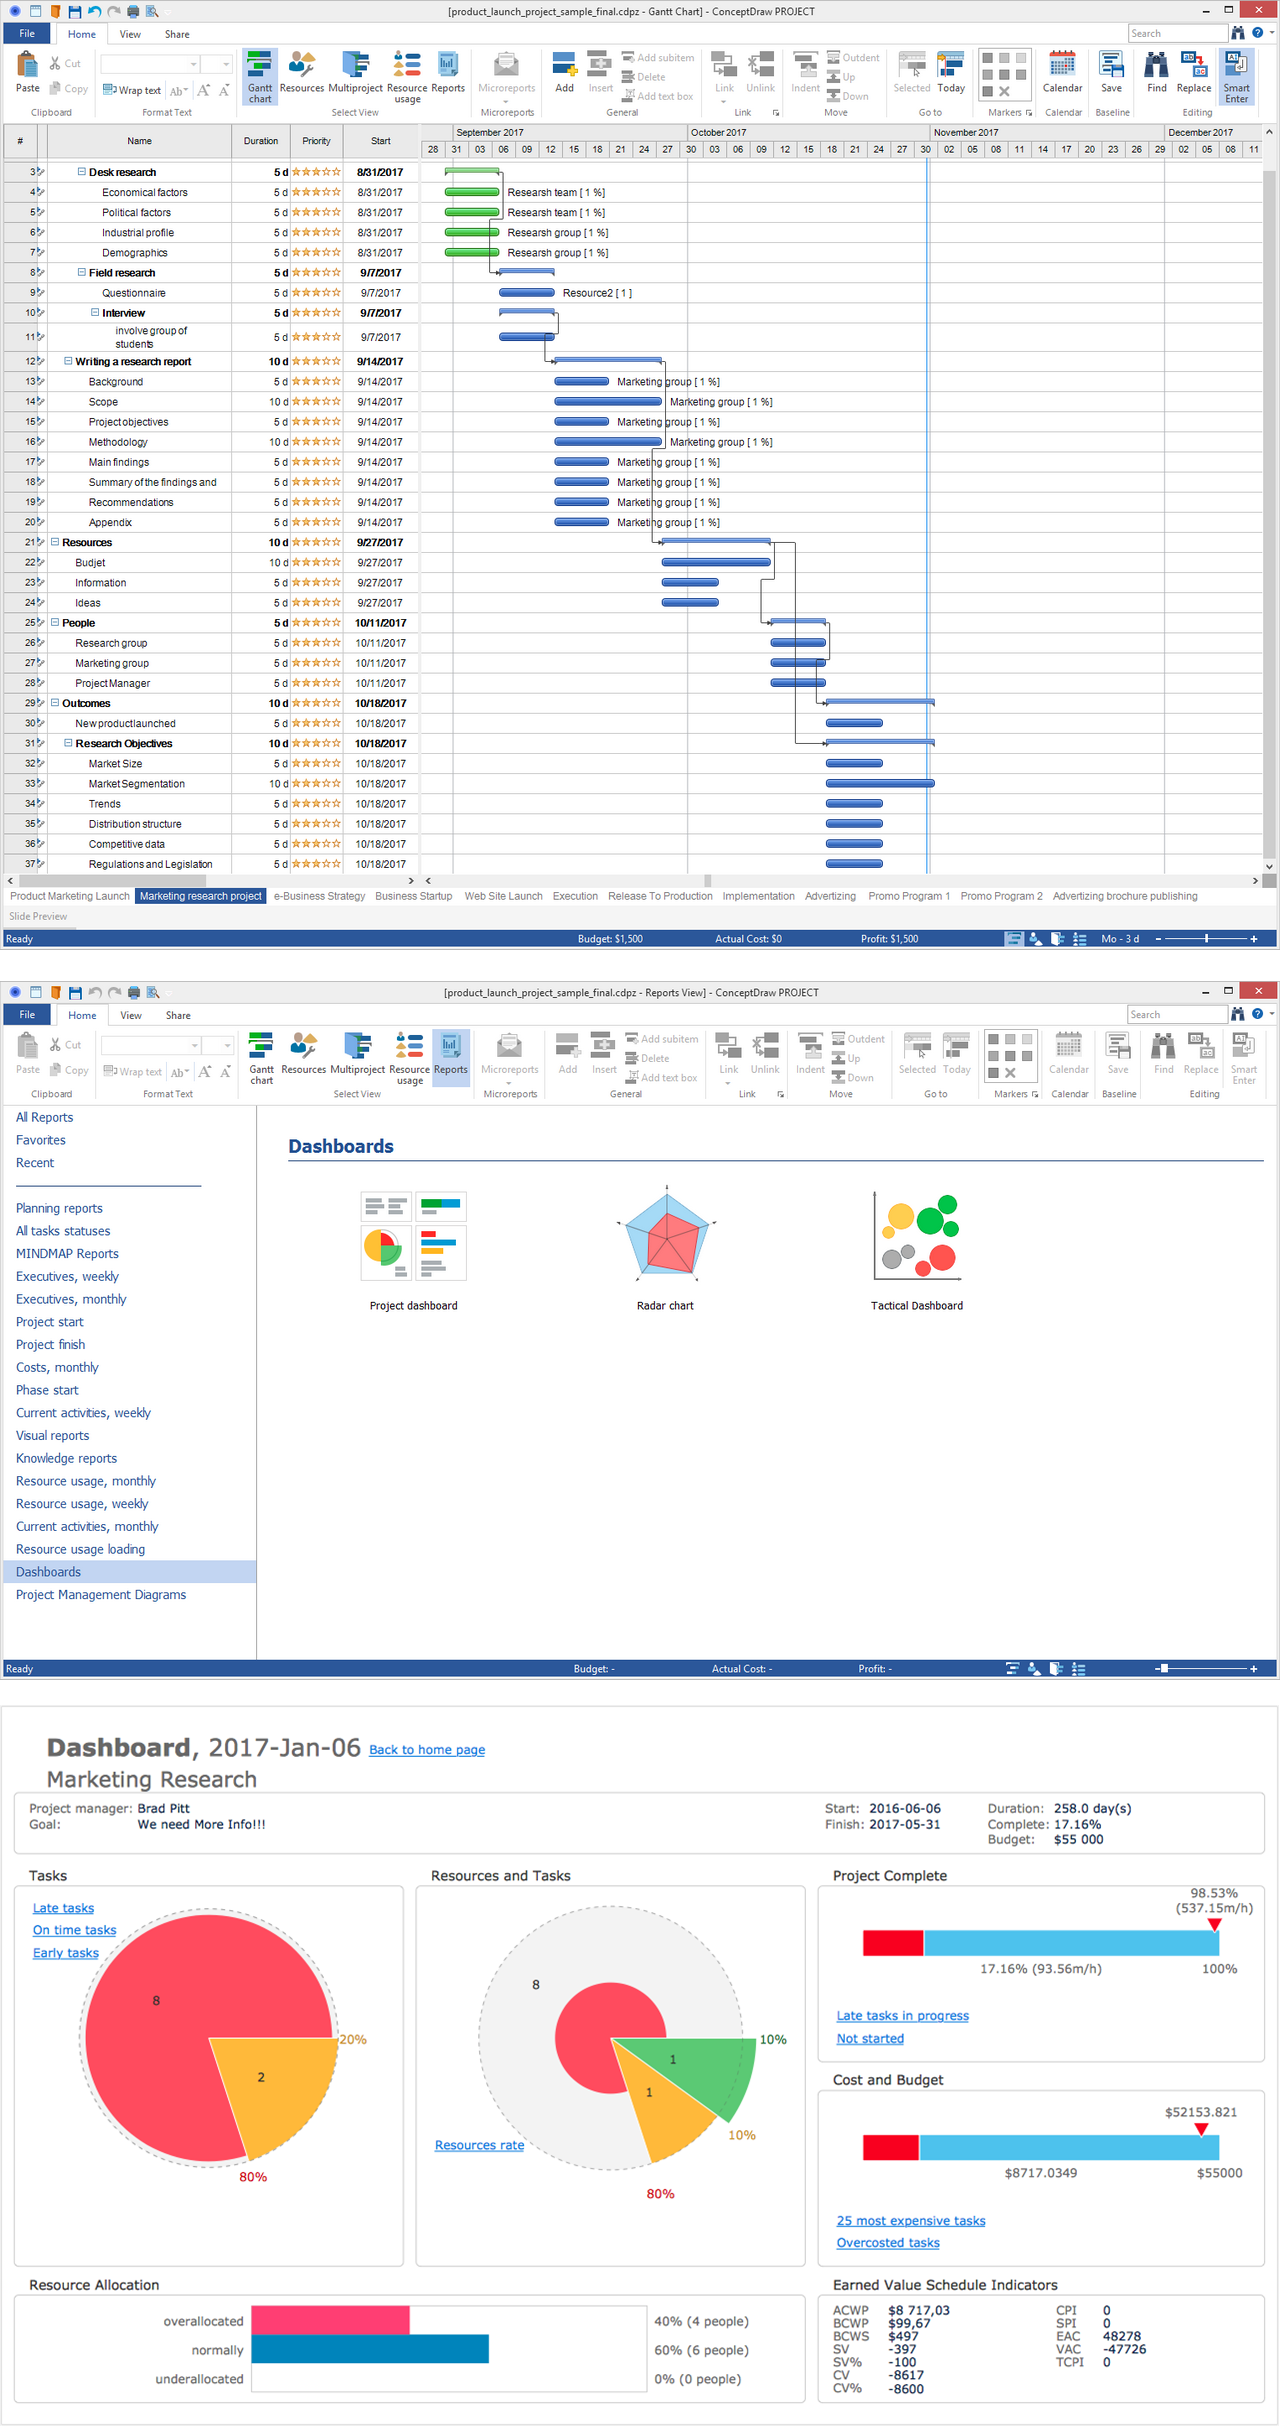
Pic 1. Project — Dashboard
The simultaneous managing of multiple projects is especially heavy work, but the ConceptDraw PROJECT software provides you with invaluable assistant in a form of Project Dashboard report for the multi-project. It can be generated in one click, contains the Visual Project Dashboards with summary information for each project on the separated pages of a multipage ConceptDraw DIAGRAM document and also the progress bars for all projects on the first page. All this information is incredibly important for the project manager on purpose of definition the projects progress, their statuses in comparison to the plan, and for identification what projects require the immediate attention and immediate actions.