Radial Tasks Structure
One of the most effective ways of looking at any project, on its perspectives and results of execution and development is the transformation of project data into different visual forms and generation of visual diagrams. Different kinds of diagrams cover varied aspects of a project and let one differentiate the information depending on the report objectives and audience.
The Radial Tasks Structure chart is an analogy of a Bar chart with radially located bars. These charts are visually very interesting, aesthetically beautiful and more appealing, than usual for us Line charts, Area charts, and traditional Bar charts. In ConceptDraw DIAGRAM the Radial Tasks Structure charts are constructed with the use of different colors, which additionally increase their visuality.
The Radial Tasks Structure charts are the better choice for visually explaining the structure of your project, for analyzing the task structure level by level and for comparing the values visually. The Radial Tasks Structure report is generated by ConceptDraw PROJECT from the project’s tasks with assigned human resources and it shows the work volume dramatically.
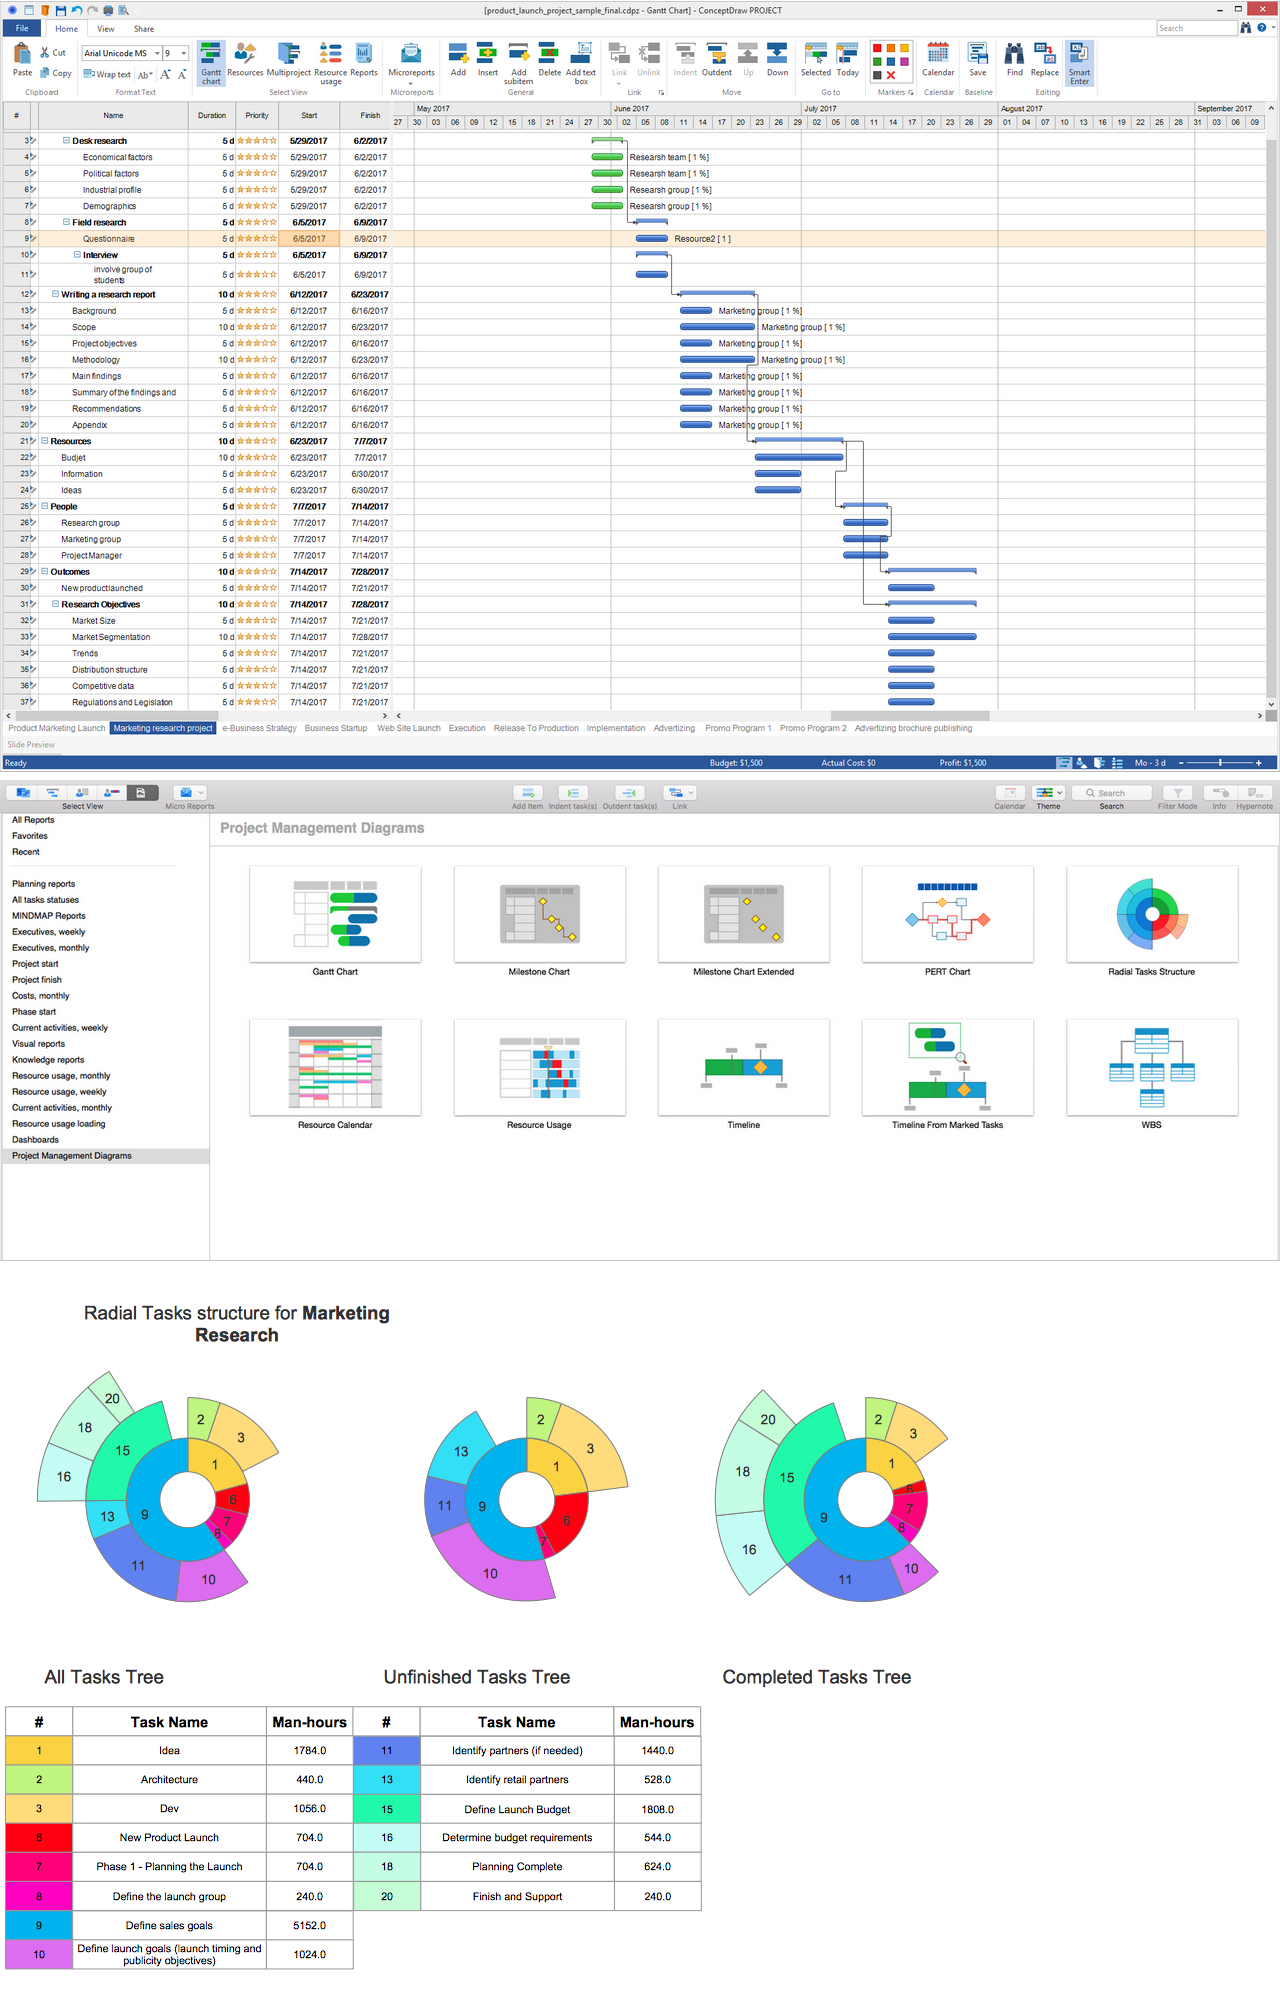
Pic 1. ConceptDraw PROJECT — Radial Tasks Structure
The Radial Tasks Structure report is produced after clicking the self-titled button at the Project Diagrams section on the Reports toolbar in ConceptDraw PROJECT and is represented by a two-page document in ConceptDraw DIAGRAM software. On the first of them the table with information about the project tasks is displayed, it involves assigned human resources - their names and quantities of man-hours, and also three Radial Diagrams representing accordingly all project tasks, unfinished tasks and completed tasks of a project. This number of diagrams can differ in accordance with your project - for the totally completed project the second diagram will be absent, as well as third diagram will be absent when there are no completed tasks in a given project. The second page of Radial Tasks Structure report contains the list of tasks without assigned human resources formed from the project data. The information about the numbers of tasks on the project Gantt Chart is also displayed in the table.
One look at this report gives the representation about the project's regularity. It is important information, because the timely detection of imperfections and correction the situation contributes for easy managing the project, while irregular projects are quite difficult to manage. Besides, the Radial Tasks Structure reports delivered by ConceptDraw Office suite for your project are professional looking, colorful, bright and attractive, and thus are so interesting for using in reports and presentations, at the meetings, discussions and conferences with colleagues.
In case of creating the Radial Tasks Structure report for a multi-project you will receive the multipage ConceptDraw DIAGRAM document with general Radial Tasks Structure chart for multi-project on one page, the set of pages with Radial Tasks Structure charts for each project separately and the pages with tables of tasks without assigned human resources for each project.