Tactical Dashboard
Notice: Undefined offset: 0 in /var/www/html/conceptdraw/project-management/template.php on line 447
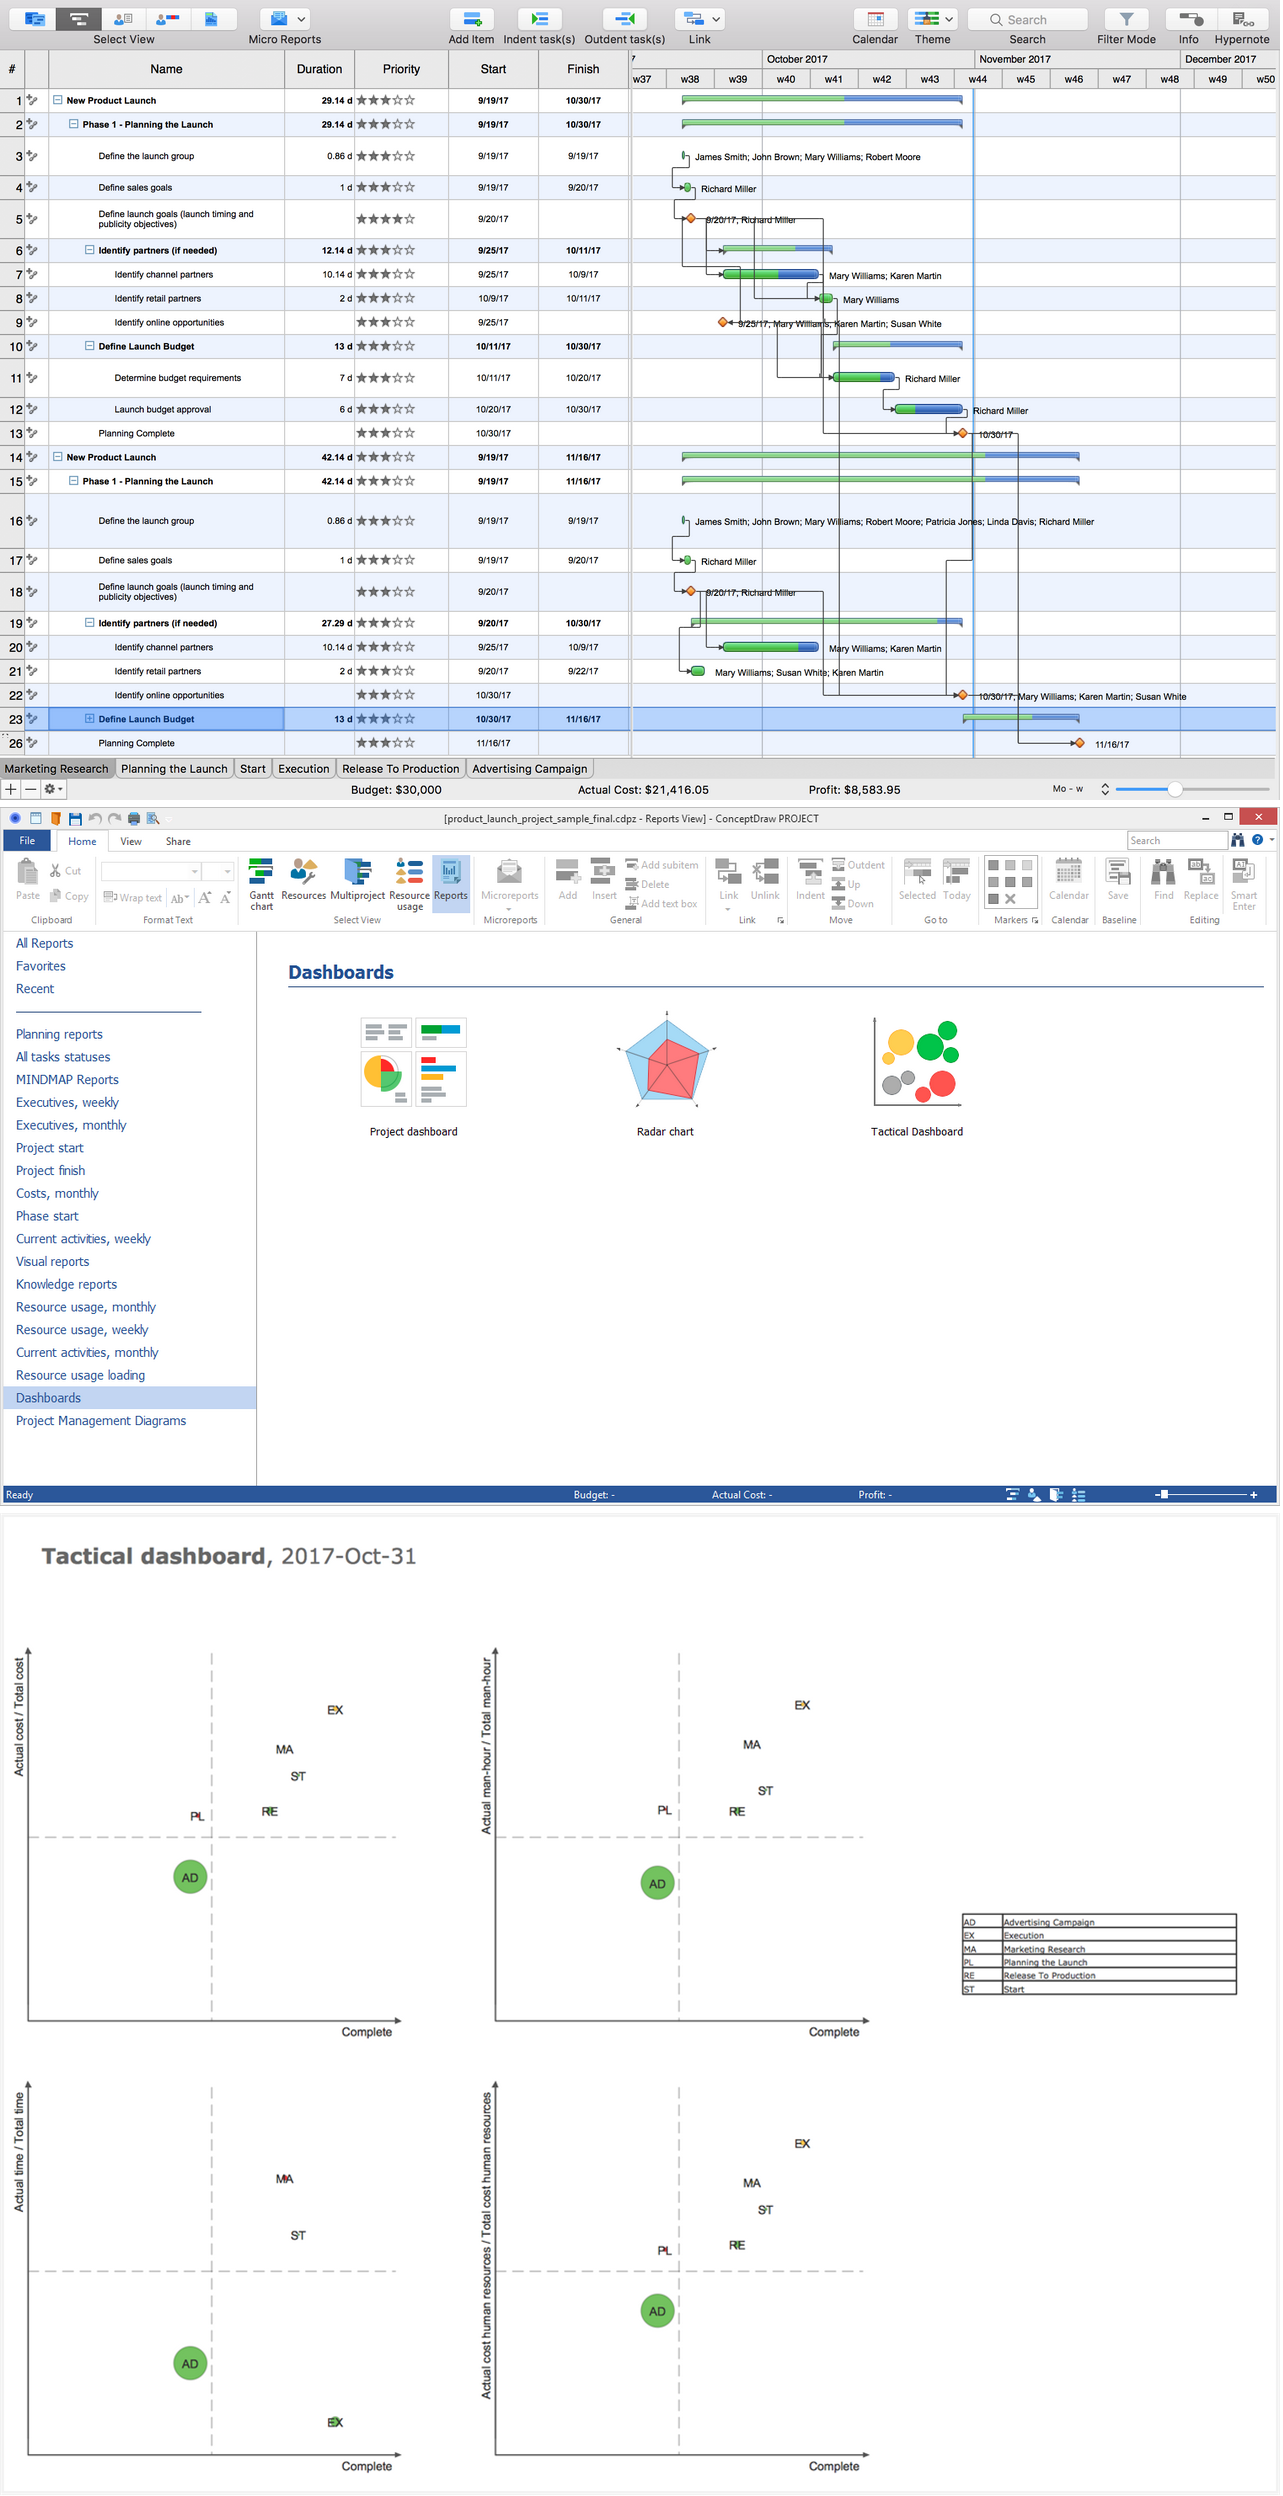
ConceptDraw PROJECT is a powerful project management software, also effective in reporting and creation three types of reports in a form of dashboards: Project Dashboard, Tactical Dashboard, and Radar Chart. The Tactical Dashboard report is generated from your project data by clicking the Tactical Dashboard button at the Dashboards section on the Reports toolbar of the program and is the best assistant in making the tactical decisions. It is a perfect way to evaluate the project's progress for some indexes, to compare the current indexes for an unfinished project, the indexes of actual progress with an expected progress.

Notice: Undefined variable: patterns in /var/www/html/conceptdraw/project-management/template.php on line 504
Warning: Invalid argument supplied for foreach() in /var/www/html/conceptdraw/project-management/template.php on line 504
Pic 1. Project — Tactical Dashboard
The Tactical Dashboard diagram opens in ConceptDraw DIAGRAM software and represents four positive quadrants in Cartesian coordinate system, which allow comparing the actual values visually and the total values of four main metrics: Cost, Time, Man-hour and Human Resources Cost. The actual cost, the actual man-hour and the actual cost for human resources are calculated as sums of the values for these metrics for all project tasks, multiplied on their Complete. The total values for these metrics are calculated as the sums of actual values for all tasks of the project. The actual time is a period between the project start date and a more earlier date from the project finish or current date, while the total time is a project duration that is calculated as a difference between the project finish and start dates.
The project's Complete is taken as a measure of comparison and is represented on the X-axis. The Y-axis depicts the relatively estimated completion of the project by any index, it is counted as a quotient of the current value and the total value. The projects are displayed as circles on the Tactical Dashboard, the circle's diameter corresponds to the absolute estimated completion by any index, calculated as a difference between the current value and the total value, the circle's color reflects the result of comparison of relative estimated completion and project Complete: the ahead is represented by green color, the lag - by red color, and yellow color reflects the projects that go in time. At this, the biggest circle is taken as 100 and the diameters of all other circles are standardized to it. The simple look on the Tactical Dashboard lets evaluate the project progress in a moment, the main signs indicating the progress are the decrease of circles diameters, their yellow or green color, and the movement of circles down.