Timeline
Notice: Undefined offset: 0 in /var/www/html/conceptdraw/project-management/template.php on line 447
A timeline is typically represented by a line or a bar, on which the dates and events in a chronological order are marked. Thus, the timeline allows visualizing the subsequence of events one after another and organizing their management in time clearer. The timelines find their application in many spheres of life and activity, they are widespread in education, in teaching and studying the history especially. They are useful for a formation of a consistent view of the historical processes, for tracking the chronology of key events and interdependencies between them, they are also convenient when working with the biographies of scientific figures and writers, etc. However, a special place for the timelines to be found is project management. They help project managers and other employees mark and observe all stages of the realized project, the deadlines for each of them and the project as a whole, as well as to track the temp of its implementation.

Notice: Undefined variable: patterns in /var/www/html/conceptdraw/project-management/template.php on line 504
Warning: Invalid argument supplied for foreach() in /var/www/html/conceptdraw/project-management/template.php on line 504
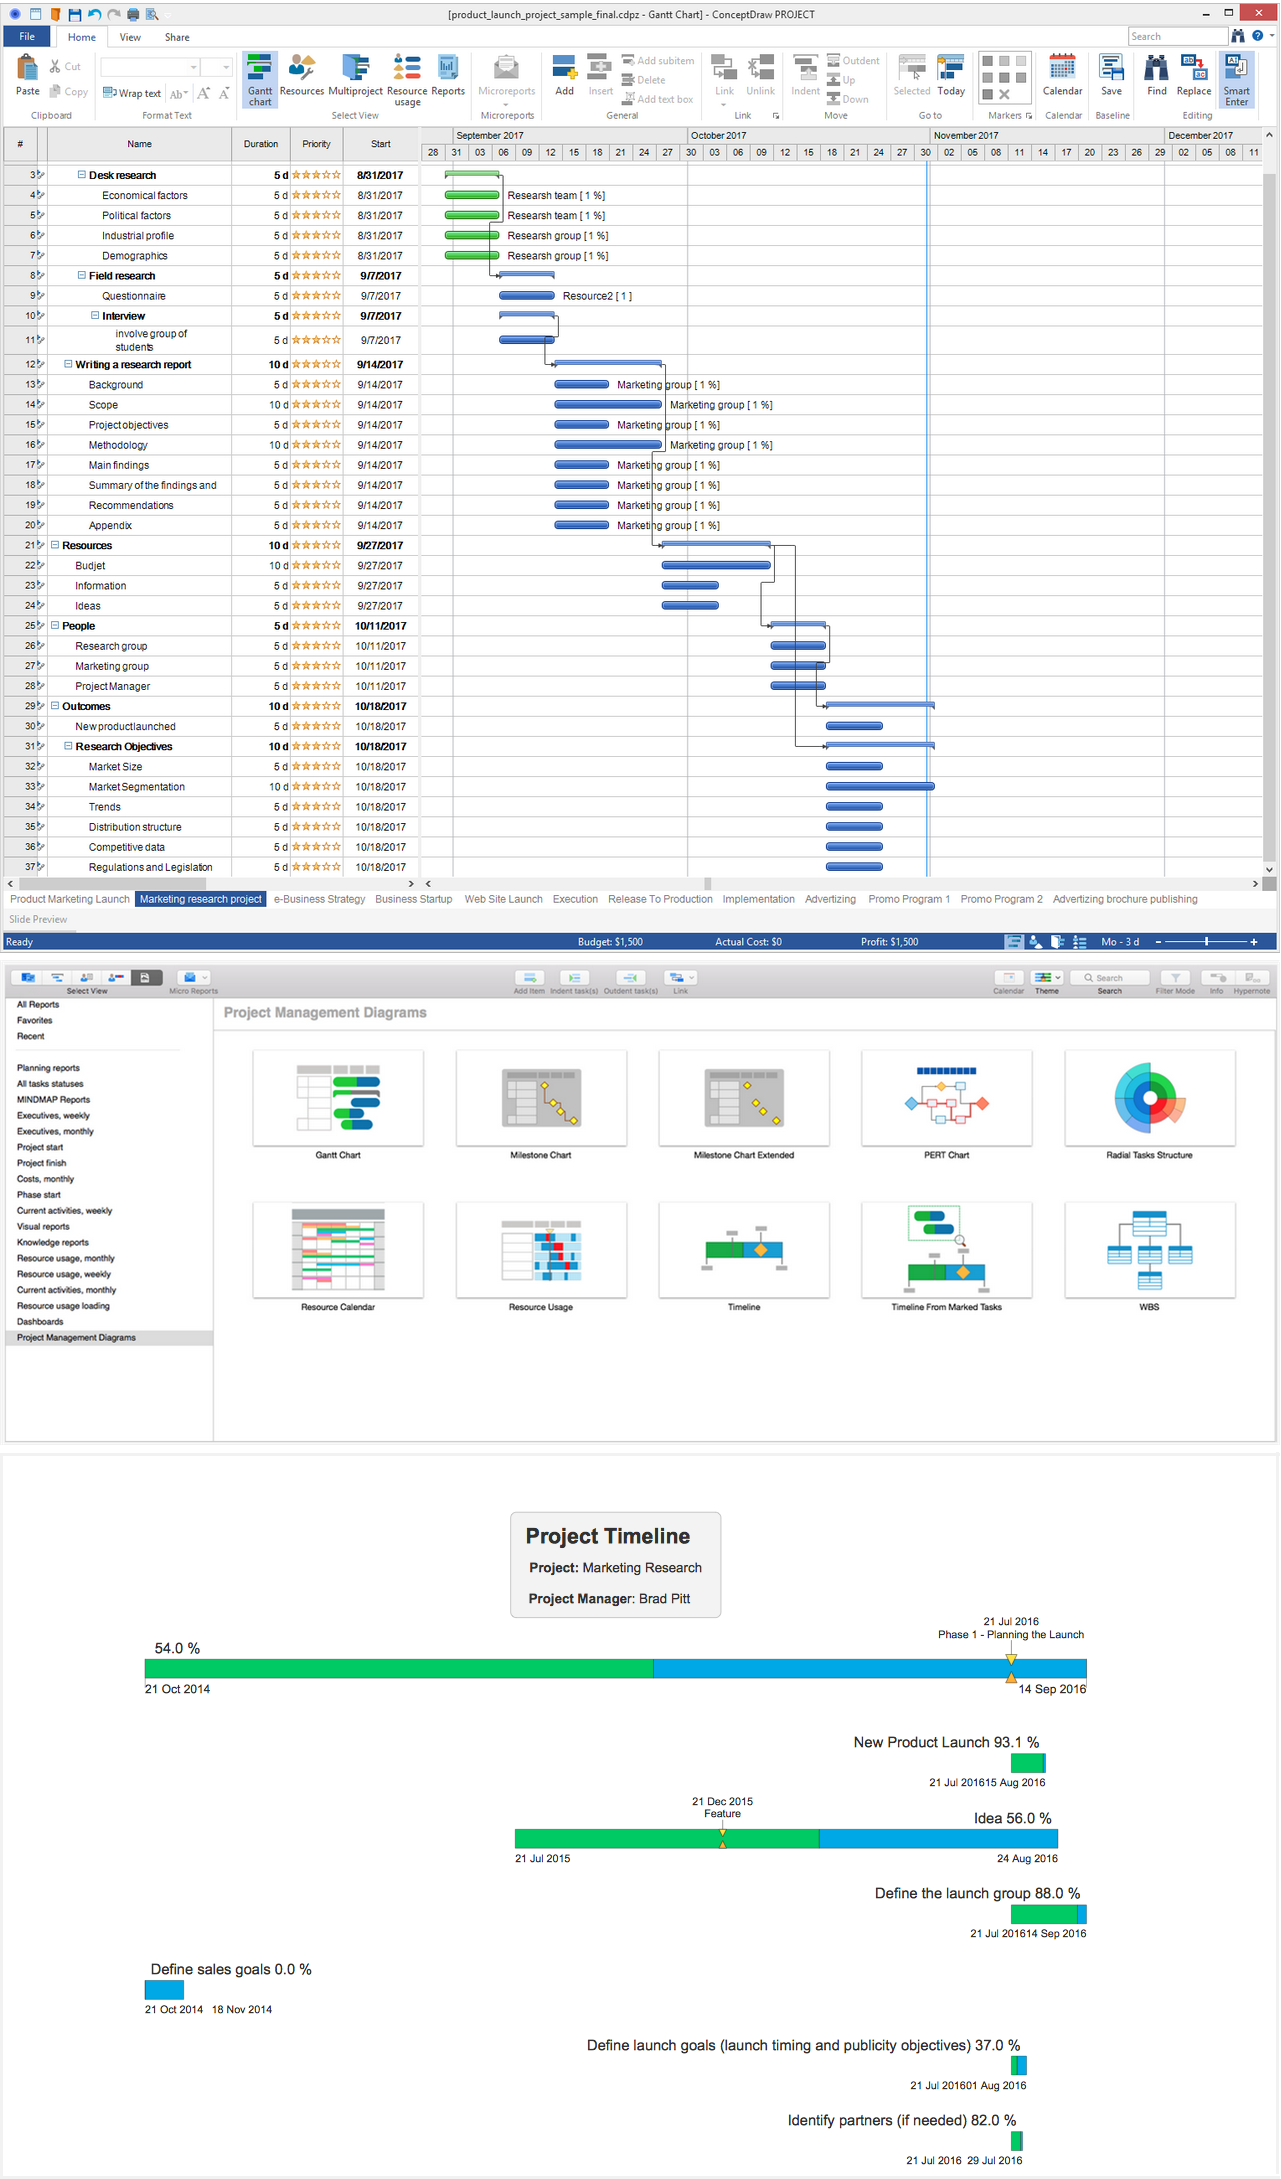
Pic 1. ConceptDraw PROJECT — Timeline
When working with large and complex projects, which consist of the several stages and are realized during the long time period, it is particularly important to be able to see the chronology of tasks and phases in a simple and visual form. The ConceptDraw PROJECT software lets visualize this chronology on the Timeline report. Create it quickly and easily using the button Timeline from the Project Diagrams section on the Reports toolbar. The Timeline visual report is generated from the project data at ConceptDraw PROJECT software and is represented as a diagram at ConceptDraw DIAGRAM software included to ConceptDraw OFFICE suite.
The Timeline visual diagram report constructed for your project represents the project's timeline and shows the degrees of the task completion of the first outline level, all numerical data is represented in percent. ConceptDraw PROJECT software allows creating the reports for projects of any complexity and number of tasks, as well as for the multi-projects. The Timeline visual report for a multi-project is a multipage ConceptDraw DIAGRAM document, on the first page the progress (level of completion) is shown generally for the whole multi-project and individual timelines for each project from a given multi-project. Timeline diagrams for all projects from this multi-project are represented on the rest pages of this report, each project on its own page. The use of blue and green colors for coloring the timelines helps visually detect the degree of completion of the tasks and projects, immediately assess this data and compare it in a moment.