Customer Relationship Management
Sales Dashboard Solution
The Sales Dashboard Solution gives users the ability to use live data to drive displays that show sales performance in a wide variety of graphs. ConceptDraw DIAGRAM is a software for making Live charts anв gauges that provide effectiveness to your business. By using dashboards one obtain benefits:
- Visual presentation of performance measures
- Quick identification of data outliers and correlations
- Gain total visibility of all systems instantly
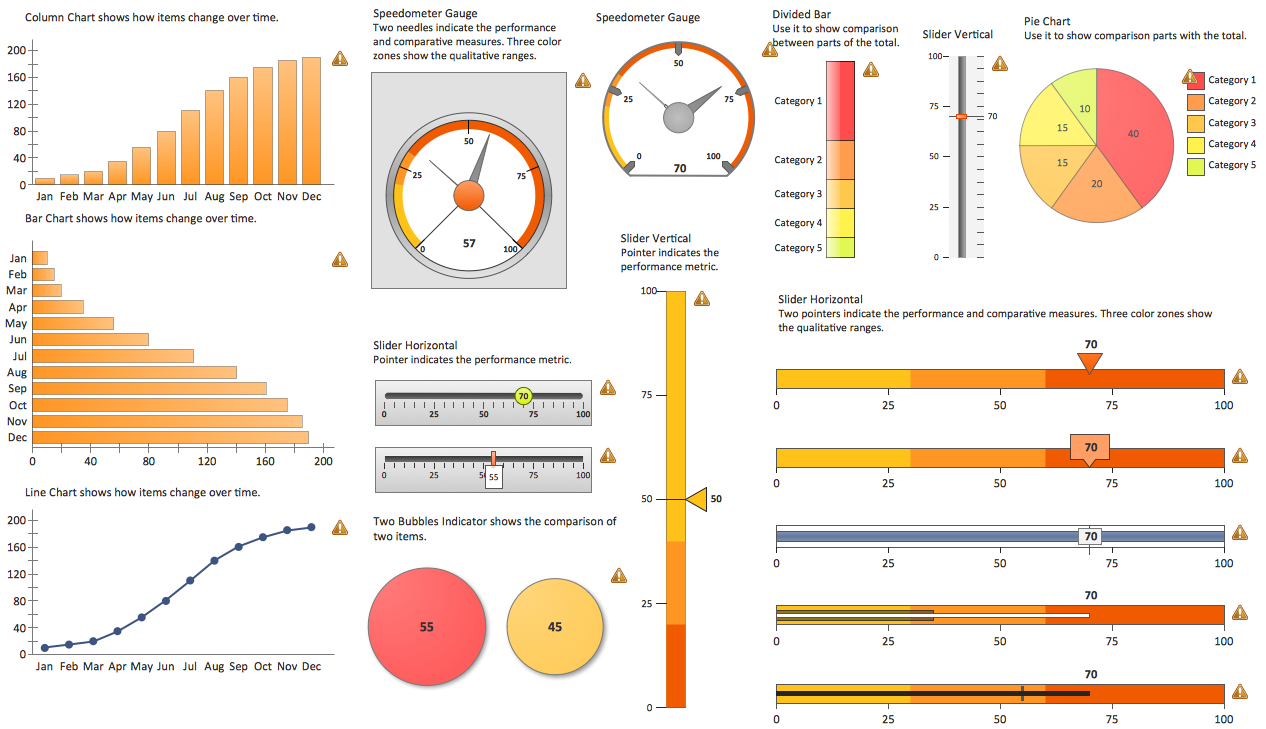
Pic. 1. Sales Dashboard - Design Elements
TEN RELATED HOW TO's:
The most worked out and commonly used methodology of business processes description is IDEF methodology. Besides business processes it allows to describe functional blocks, for example production and marketing. ConceptDraw lets creation of business processes description using IDEF0 and IDEF2 methods.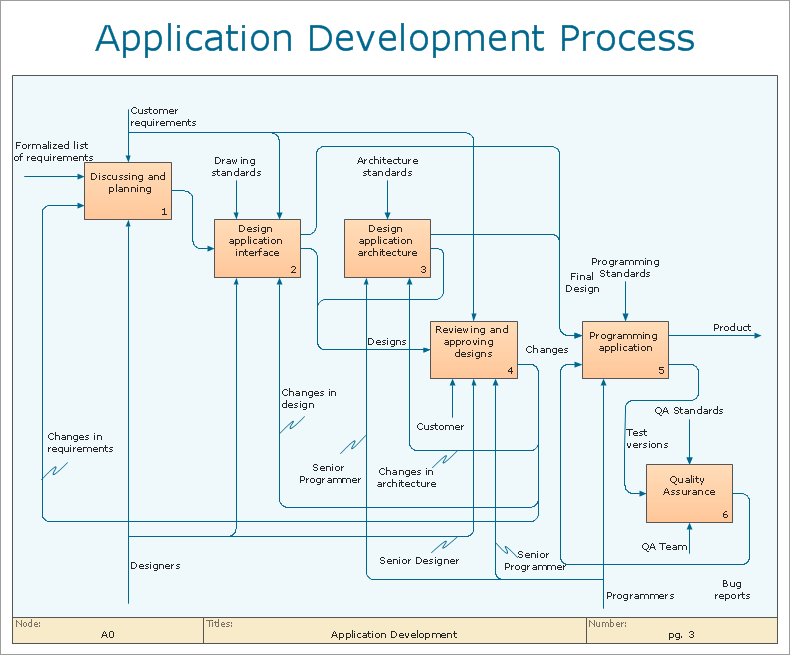
Picture: Business Processes
Related Solution:
A more detailed mind map that organizes documents required for a product proposal.
Picture: Product Proposal Documents Expanded
Related Solution:
ConceptDraw Arrows10 Technology - This is more than enough versatility to produce professional diagrams more quickly.
Professional diagramming software for mac helps you create variety diagrams, graphics, charts, live dashboards and plenty of graphics and pictures for your business and study.
Picture: Produce Professional Diagrams More Quickly, Easily and Cost Effectively
Big and complex projects sometimes need some simplification of plans and schedules. That's why Program Evaluation and Review Technique was invented and first implemented in 1958. You can create PERT diagrams effortlessly with ConceptDraw DIAGRAM and share them with your colleagues.
Program Evaluation Review Technique (PERT) is a method that is used to assess and analyze projects. PERT is a valuable tool for the project management practice. PERT gives an assessment and analysis of the time needed to the project completion. A PERT chart is a visual tool that delivers a graphical view of a project timeline. It is used to display the sequences and dependences of project tasks necessary to complete a project. ConceptDraw DIAGRAM delivers the possibility to build a PERT along with other diagrams applied to assist management process by using its Seven Management and Planning Tools solution.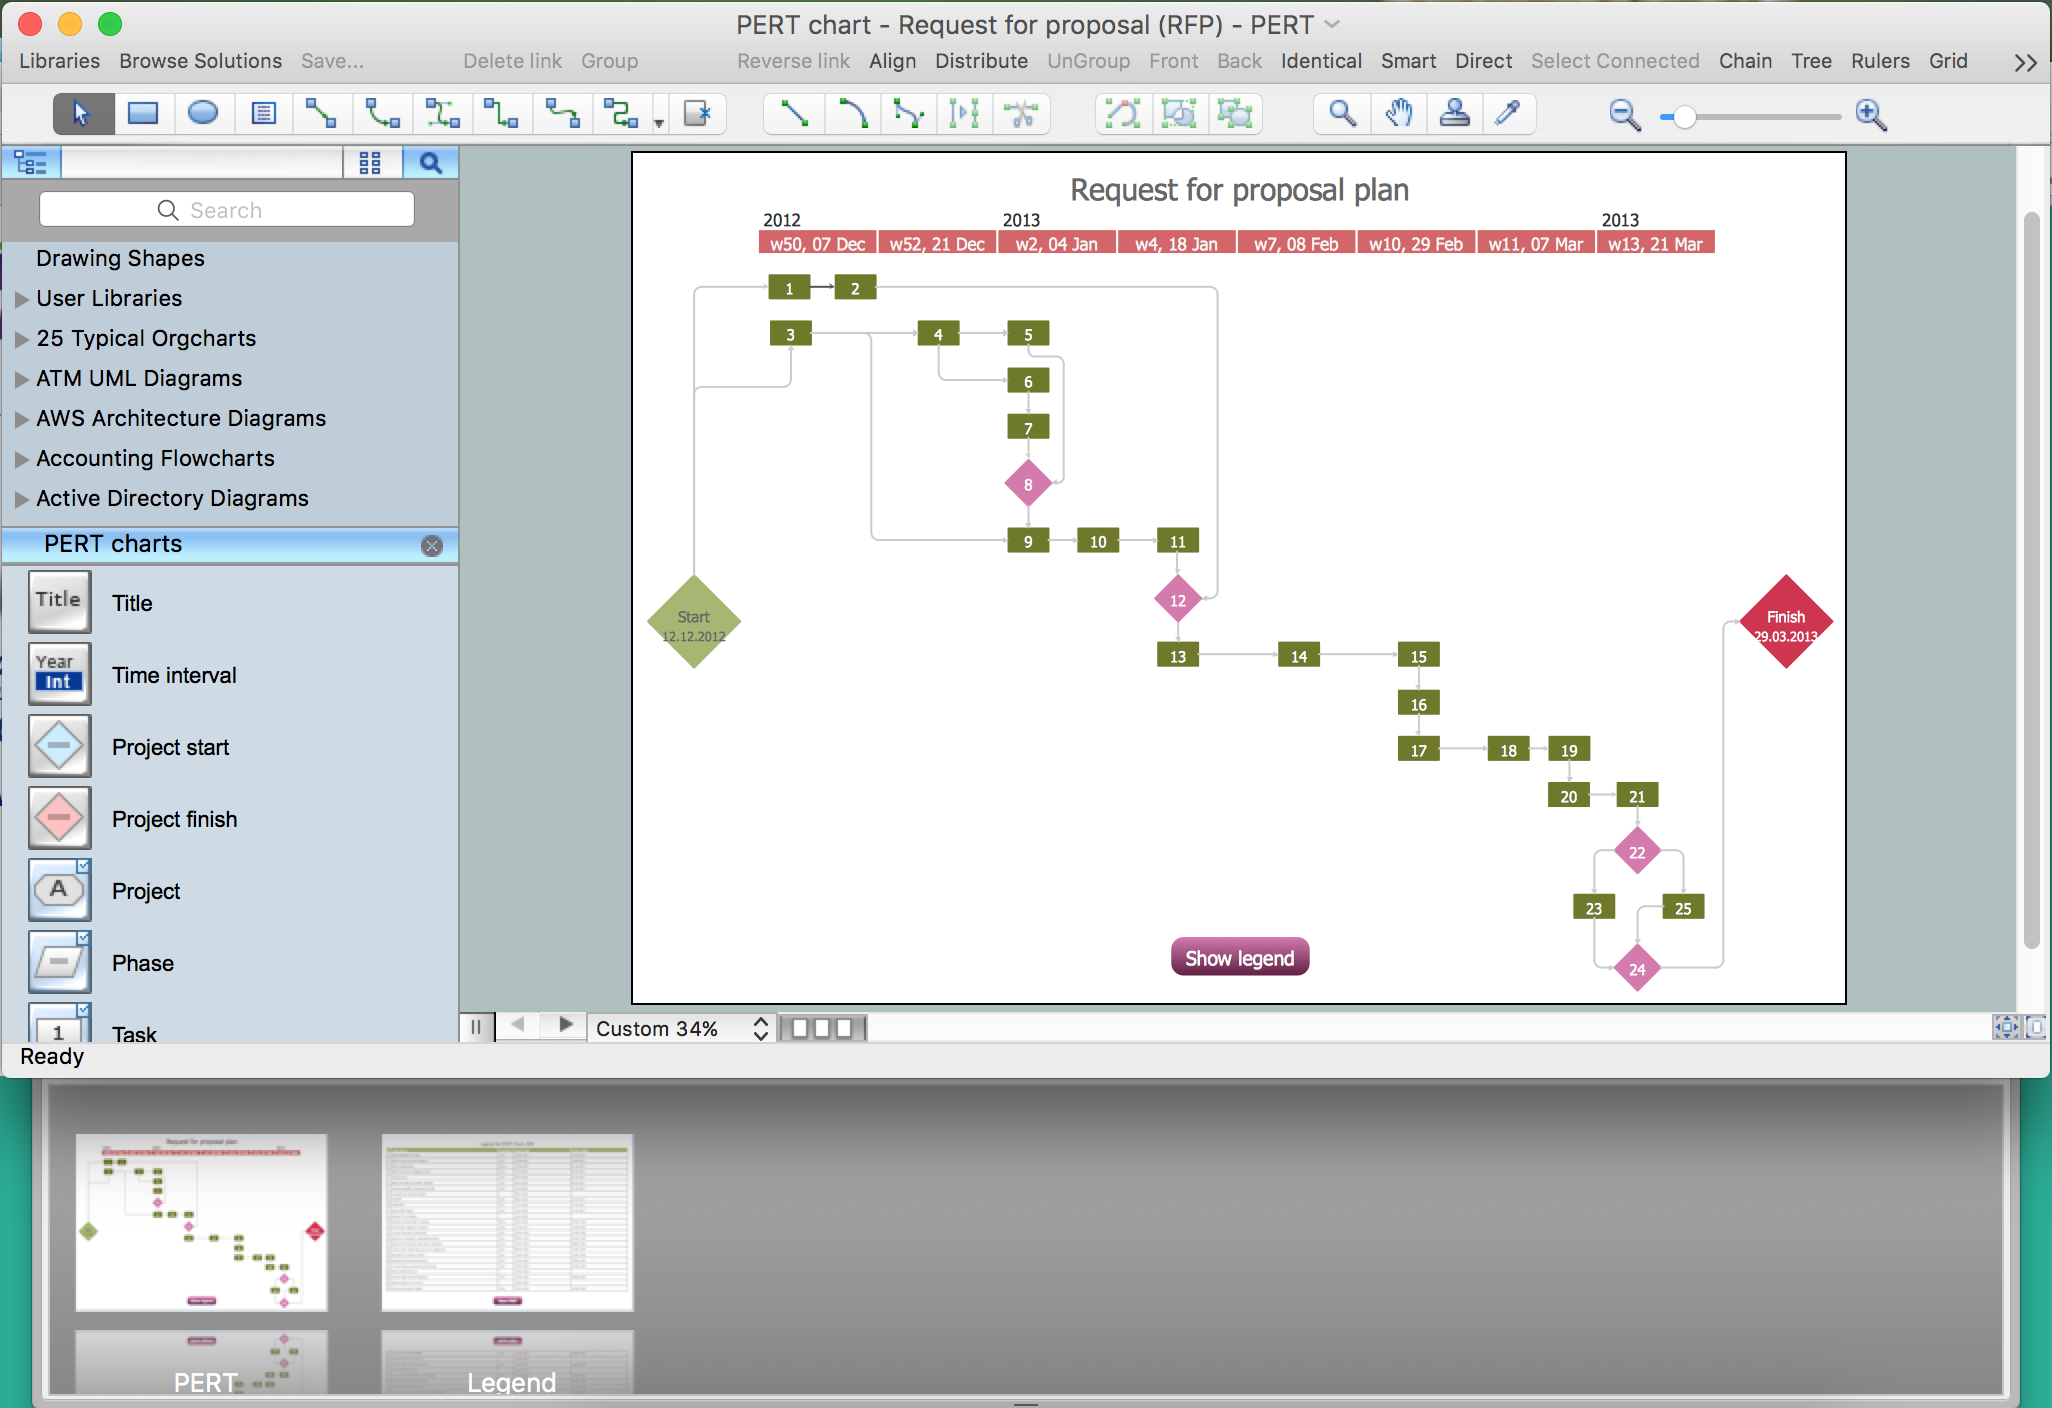
Picture: Program Evaluation and Review Technique (PERT) with ConceptDraw DIAGRAM
Related Solution:
Gant Chart is a graphical representation of tasks as segments on a time scale. It helps plan and monitor project development or resource allocation. The horizontal axis is a time scale, expressed either in absolute or relative time.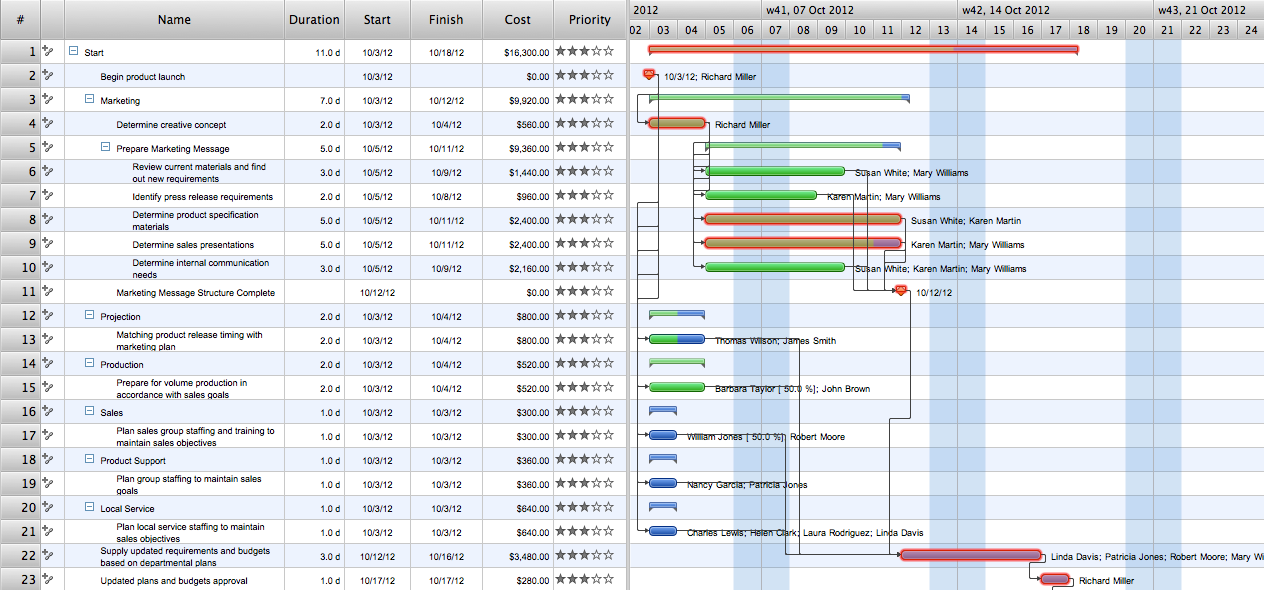
Picture: Gant Chart in Project Management
Related Solution:
The Total Quality Management Diagram solution helps you and your organization visualize business and industrial processes. Create Total Quality Management diagrams for business process with ConceptDraw software.
Picture: TQM Diagram Example
Related Solution:
You can design the Prioritization Matrix by hand on the paper, but we offer you the most easier way — to use the ConceptDraw DIAGRAM diagramming and vector drawing software extended with Seven Management and Planning Tools Solution from the Management Area.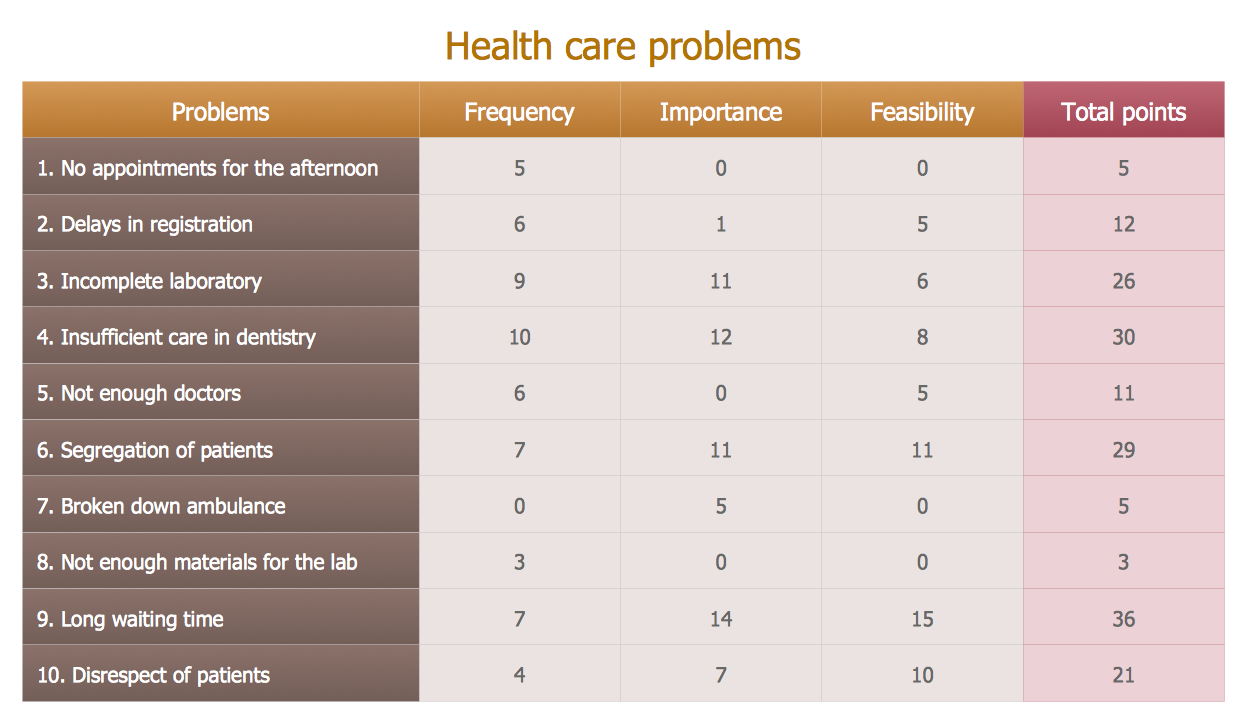
Picture: Prioritization Matrix
Related Solution:
ConceptDraw DIAGRAM is workflow diagram software enhanced by numerous extentions from ConceptDraw Solution Park. It inludes many professional workflow diagrams, examples and ready to use workflow diagram and workflow symbols. Workflow symbol collections include symbols for Processes, Planning, Scheduling, Flow Control, In-Transit Process Visibility.
The best workflow diagram software you may find is ConceptDraw DIAGRAM. ConceptDraw DIAGRAM is world-known diagramming software that works for both Windows and Mac OS X platforms. The software contains complete set of features allows to draw diagrams faster. ConceptDraw DIAGRAM extended with the Workflow Diagram solution provides additional libraries, templates and samples for drawing professional workflow diagrams.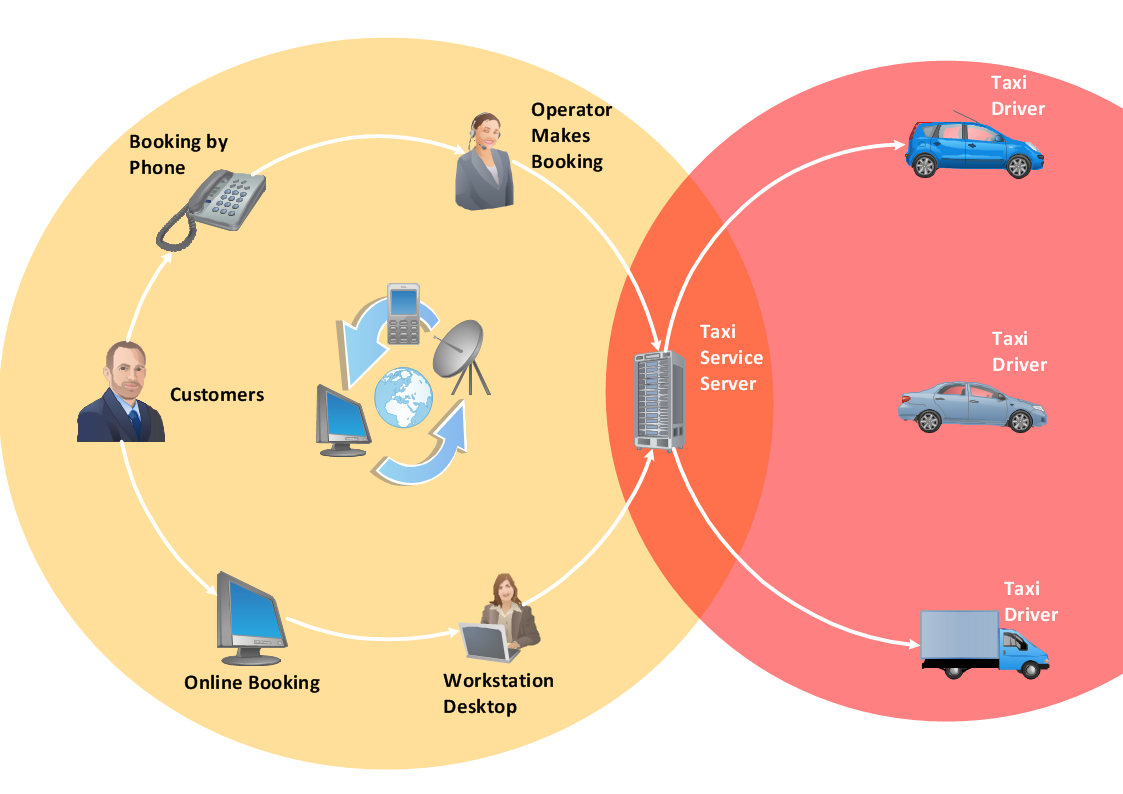
Picture: Workflow Diagram Software
Related Solution:
Preventive Action - ConceptDraw OFFICE suite is a software for the Preventive Action making. The Seven Management and Planning Tools solution is a set of such tools for problems preventive actions via investigating of the core problem.
Skilled use of these diagrams makes collaborative teamwork both more engaging and more effective.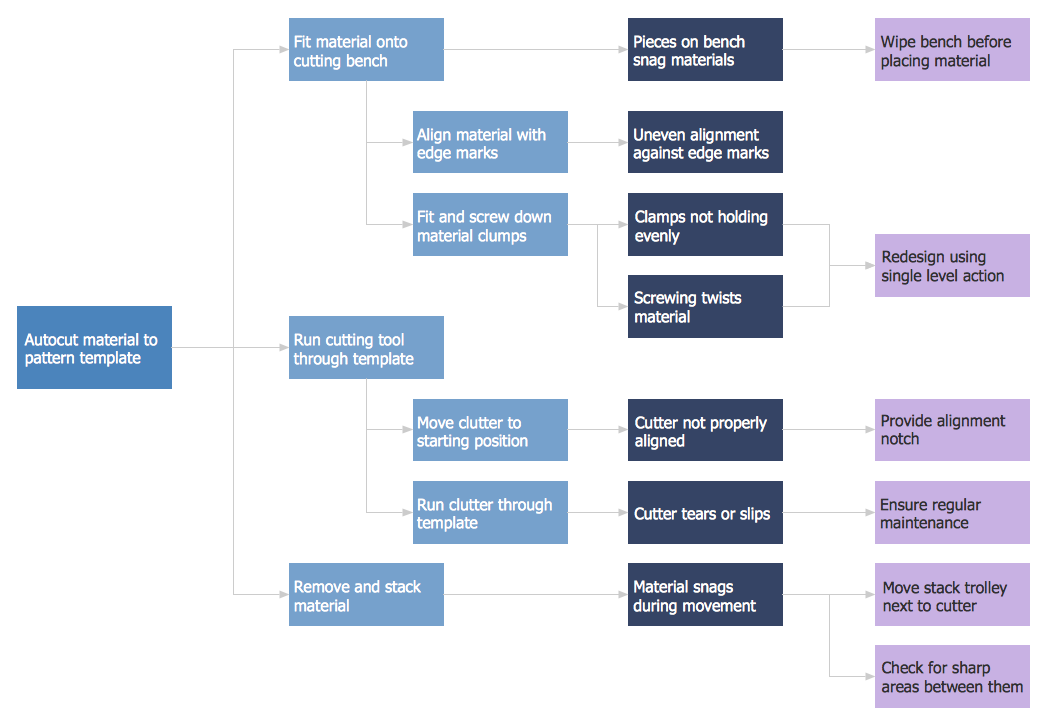
Picture: Preventive Action
A key point of conference success is the ability to see slides in real time, and hold documented discussions during the meeting. Remote Presentation for Skype is a new solution allows real-time presenting that benefits work groups who need collaborate by web meetings.
Picture: Tool for Workgroup Briefings, Meetings and Decisions
Related Solution:
ConceptDraw
DIAGRAM 18