Education Infographics
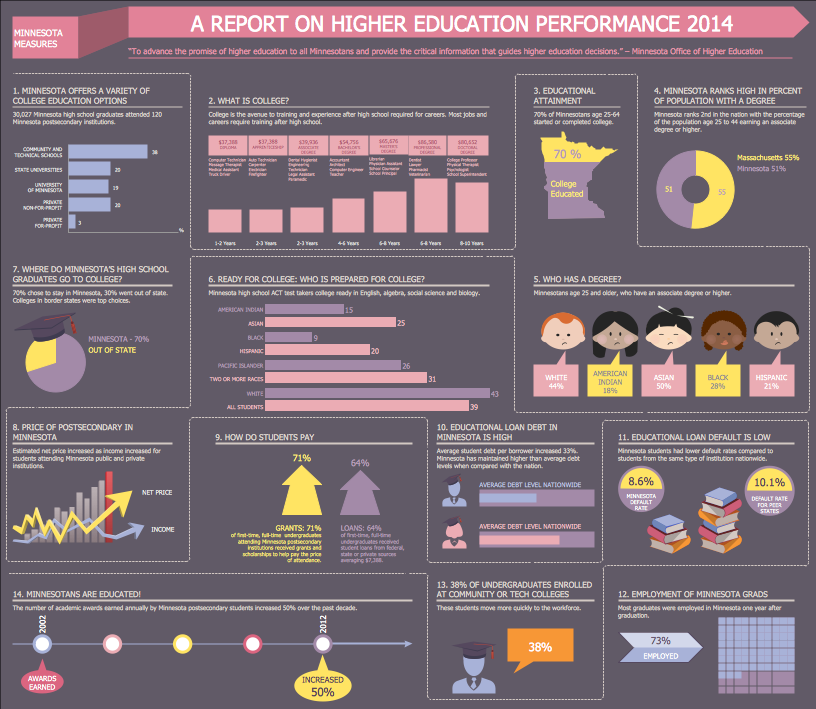
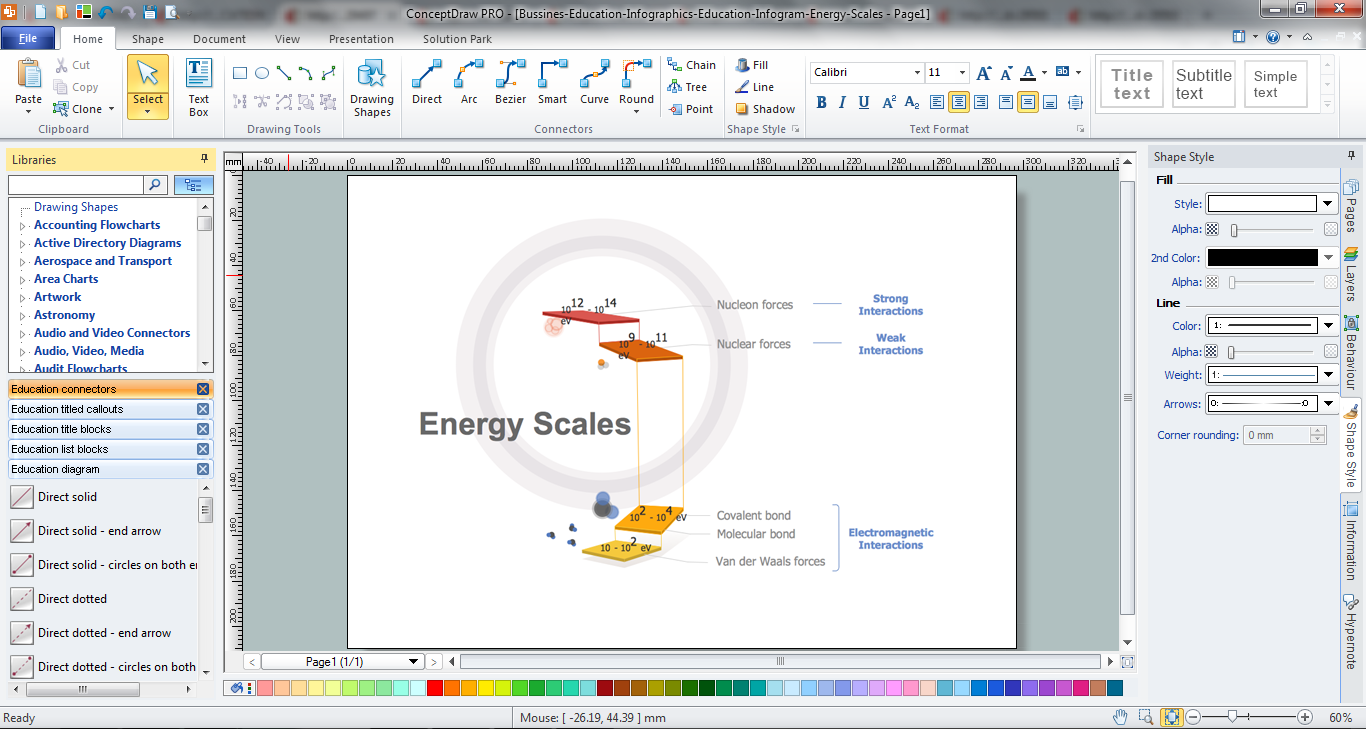
The Education Infographics are popular and effectively applied in the educational process. Now you don't need to be an artist to design colorful pictorial education infographics thanks to the unique drawing tools of Education Infographics Solution for ConceptDraw PRO diagramming and vector drawing software.Educational Materials
It is impossible to imagine the education process without educational materials and auxiliary illustrations. And it is important that they will be bright, interesting and attractive for the pupils and students.ConceptDraw PRO diagramming and vector drawing software offers the Education Infographics Solution from the Business Infographics Area to help each education-related person create professional looking and attractive educational materials.
Information Graphic
Information graphic or infographic is a visual representation of various information, data or knowledge. ConceptDraw PRO extended with unique Education Infographics Solution from the Business Infographics Area will help you design any education information graphic without efforts.How to Make an Infographic
How to Make an Infographic quick and easy? The perfect way is to use the ConceptDraw PRO diagramming and vector drawing software extended with Education Infographics Solution from the Business Infographics Area.Make an Infographic
You want to make an infographic and need the useful and convenient drawing tools for this? In this case the ConceptDraw PRO software extended with Education Infographics Solution is a real godsend for you.Educational Technology Tools
What are the favorite educational technology tools and techniques for teachers? Of course these are pictures, images and education infographics! ConceptDraw PRO software supplied with Education Infographics Solution from the Business Infographics Area provides powerful drawing tools to help design the education infographics of any complexity.Education Information
The Education Information is multifariuos and can be often represented in various forms. Еру the most successful ways of presentation the information and data are various illustrations, diagrams and colorful education infographics which you can easily make in ConceptDraw PRO software extended with Education Infographics Solution from the Business Infographics Area.How to Draw Pictorial Chart. How to Use Infograms
How to draw pictorial chart quick, easy and effective? ConceptDraw PRO offers the unique Pictorial Infographics Solution that will help you!Pictorial Infographics solution contains large number of libraries with variety of predesigned vector pictograms that allows you design infographics in minutes. There are available 10 libraries with 197 vector pictograms.
Infographic Maker
Infographic is a visual way of representing various information, data, knowledge in statistics, geography, journalism, education, and much more areas. ConceptDraw PRO supplied with Pictorial Infographics Solution from the “What are Infographics” Area, provides a set of powerful pictorial infographics tools. Thanks to them it is the best Infographic Maker.Design Pictorial Infographics. Design Infographics
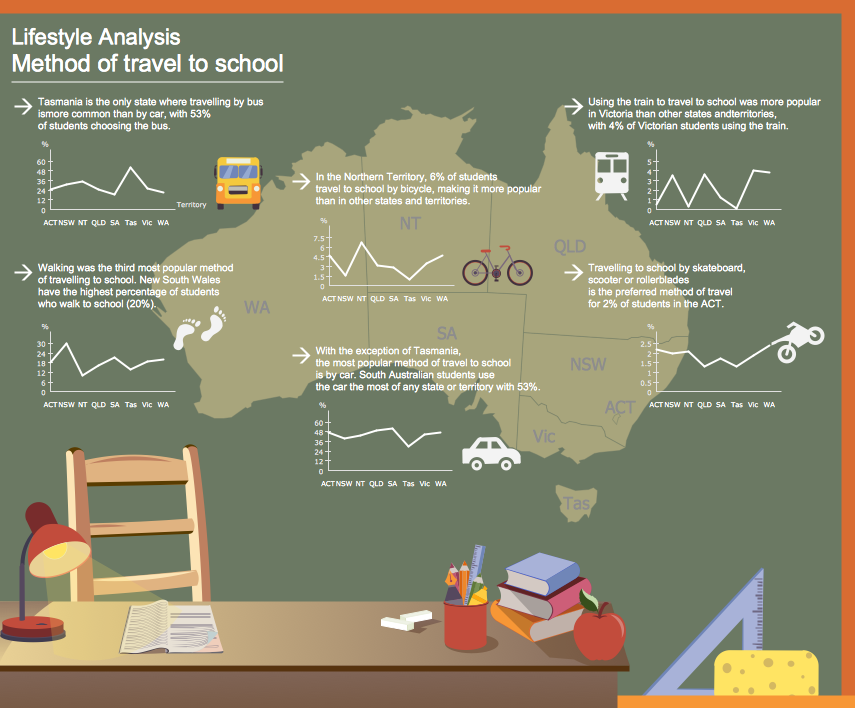
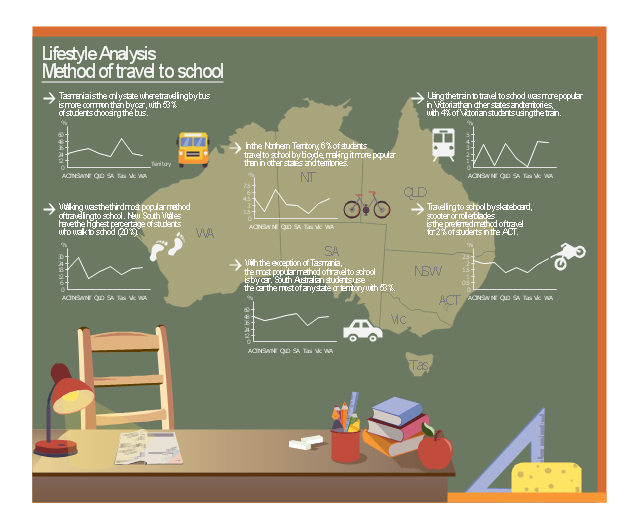
Design Pictorial Infographics - Pictorial Infographics solution also provides large collection of sample infographics and templates to be filled in. When you design infographics illustrations, you can use the offered templates and samples as the base for your own pictorial infographics documents, or create them de novo simply dragging the pictograms from the libraries and adding the text. You are free to use the predesigned pictograms as you like - separately, combine them, impose one pictogram on top of another, rotate, copy, etc.This example was designed on the base of infographic "Lifestyle Analysis. Method of travel to school in 2011" from the CensusAtSchool Australia website of the Australian Bureau of Statistics (ABS). [abs.gov.au/ websitedbs/ cashome.nsf/ 4a256353001af3ed4b2562bb00121564/ 41b786978bda4617ca25795d0004f35b/ $FILE/ ATT1ZZFV.pdf/ 1infographic_ travel_ 2011.pdf]
"National Summary Tables.
These tables indicate the trends, habits, attitudes and lifestyles of Australian students; however, they don't represent all Australian students, just those who voluntarily completed questionnaires. ...
Tables ... have infographics that you can view and download." [abs.gov.au/ websitedbs/ cashome.nsf/ 4a256353001af3ed4b2562bb00121564/ 1b426c2827e1d7f9ca2578db0015e3b1!OpenDocument]
The infographic example "Lifestyle analysis - Method of travel to school" was created using the ConceptDraw PRO diagramming and vector drawing software extended with the Education Infographics solition from the area "Business Infographics" in ConceptDraw Solution Park.
Used Solutions
Sample Pictorial Chart. Sample Infographics
Sample Pictorial Chart - Pictorial Infographics solution provides easy-to-use design infographics drawing tools, large collection of different sample infographics and infograms, sample pictorial chart and templates to be filled in, and 10 libraries with great quantity of predesigned vector pictograms.Use Pictorial Infographics solution to draw your own design pictorial infographics documents quick and easy.
 Picture Graphs
Picture Graphs solution extends ConceptDraw PRO software with templates, samples and library of vector stencils for drawing the picture charts.
 Pie Charts
Pie Charts solution extends ConceptDraw PRO software with templates, samples and library of vector stencils for drawing the pie and donut charts.
 What are Infographics Area
Solutions of the area What is Infographics from ConceptDraw Solution Park collect templates, samples and vector stencils libraries with design elements for the drawing information graphics.
 Divided Bar Diagrams
Divided bar diagrams solution extends ConceptDraw PRO software with templates, samples and library of vector stencils for drawing the divided bar charts.
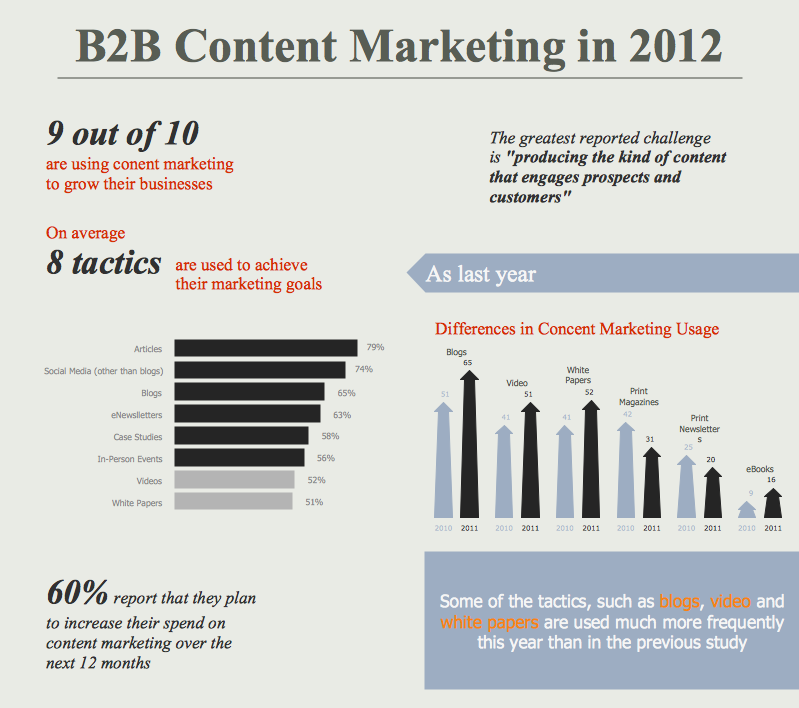
Content Marketing Infographics
The popularity of visual content marketing grows day by day. So now simple and convenient designing of professional looking Content Marketing Infographics becomes increasingly actual. For achievement this goal ConceptDraw PRO software offers the Marketing Infographics Solution from the Business Infographics Area.
 Presentation Exchange
This solution extends ConceptDraw MINDMAP software with the ability to import presentations from Microsoft PowerPoint, as well as enhancing its existing presentation capabilities.
 Audio, Video, Media
This solution extends ConceptDraw PRO software with samples, templates and library of vector clipart of audio, media, video and photo equipment for drawing the illustrations.
- Education | Scientific Symbols Chart | Basic Diagramming ...
- Picture Graphs | Building Drawing Software for Design Sport Fields ...
- Basic Diagramming | Scientific Symbols Chart | Venn diagrams with ...
- Basic Diagramming | Venn diagrams with ConceptDraw PRO ...
- Concept maps with ConceptDraw PRO | Education | What is ...
- Basic Diagramming | Venn diagrams with ConceptDraw PRO ...
- Basic Diagramming | Scientific Symbols Chart | ConceptDraw ...
- ConceptDraw Solution Park | Sample Project Flowchart. Flowchart ...
- Circles Venn Diagram
- PERT chart template | Program Evaluation and Review Technique ...
- Basic Circles Venn Diagram. Venn Diagram Example | ORM ...
- Small Business Statistics – UK 2013 | Geo Map - Europe - United ...
- Picture graph
- Mathematics | Basic Diagramming | Venn diagrams with ...
- Basic Diagramming | Scientific Symbols Chart | Scatter Chart ...
- Basic Diagramming | Solving quadratic equation algorithm ...
- Venn diagrams with ConceptDraw PRO | Mathematical pendulum ...
- Mind Map Making Software | Presentation Clipart | ConceptDraw ...
- Winter Sports. Illustrations and Visualize Statistics | Workflow ...
- Basic Diagramming | Mathematical pendulum diagram | Venn ...

