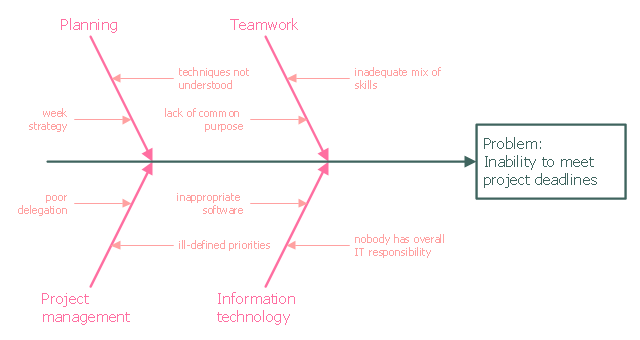
Fishbone Diagram Template
A causal model is an abstract concept, that describes the causal mechanisms of a system, by noting certain variables and their influence on each other, in an effort to discover the cause of a certain problem or flaw. This model is presented in diagram form by using a fishbone diagram.ConceptDraw PRO diagramming and vector drawing software enhanced with Fishbone Diagrams solution helps you create business productivity diagrams from Fishbone diagram templates and examples, that provide to start using of the graphic method for the analysis of problem causes. Each predesigned Fishbone Diagram template is ready to use and useful for instantly drawing your own Fishbone Diagram.
This example was created on the base of the figure from the website of the Iowa State University Center for Excellence in Learning and Teaching.
"Fishbone.
What: The fishbone technique uses a visual organizer to identify the possible causes of a problem.
Benefits: This technique discourages partial or premature solutions and demonstrates the relative importance of, and interactions between, different parts of a problem.
How: On a broad sheet of paper, draw a long arrow horizontally across the middle of the page pointing to the right. Label the arrowhead with the title of the issue to be explained. This is the "backbone" of the "fish." Draw "spurs" from this "backbone" at about 45 degrees, one for every likely cause of the problem that the group can think of; and label each. Sub-spurs can represent subsidiary causes. The group considers each spur/ sub-spur, taking the simplest first, partly for clarity but also because a simple explanation may make more complex ones unnecessary. Ideally, the fishbone is redrawn so that position along the backbone reflects the relative importance of the different parts of the problem, with the most important at the head." [celt.iastate.edu/ creativity/ techniques.html]
The fishbone diagram example "Inability to meet project deadlines" was created using the ConceptDraw PRO diagramming and vector drawing software extended with the Fishbone Diagrams solution from the Management area of ConceptDraw Solution Park.
Cause and Effect Diagrams
Cause and Effect Diagrams are designed to identify the potential factors that cause an overall effect. The causes are grouped into the categories, each cause is a source of variation.ConceptDraw PRO powerful diagramming and vector drawing software provides the Fishbone Diagrams solution from the Management area of ConceptDraw Solution Park that allows to design the Cause and Effect Diagrams quick, easy and effective.
 Accounting Flowcharts
Accounting Flowcharts solution extends ConceptDraw PRO software with templates, samples and library of vector stencils for drawing the accounting flow charts.
 Computer Network Diagrams
Computer Network Diagrams solution extends ConceptDraw PRO software with samples, templates and libraries of vector stencils for drawing the computer network topology diagrams.
 Building Plans Area
The Building Plans Area collects solutions for drawing the building and site plans.
 Wireless Networks
The Wireless Networks Solution extends ConceptDraw PRO v10 software with professional diagramming tools to help network engineers and designers efficiently design and create wireless network diagrams that illustrate wireless networks of any speed and complexity.
 Computer and Networks Area
The solutions from Computer and Networks Area of ConceptDraw Solution Park collect samples, templates and vector stencils libraries for drawing computer and network diagrams, schemes and technical drawings.
- Business Diagram Software | Management | Fishbone diagram ...
- Fishbone Diagram | Business Productivity Diagramming | Cause ...
- Using Fishbone Diagrams for Problem Solving | Fishbone diagram ...
- Fishbone Diagram | Fishbone Diagrams | Business Productivity ...
- Fishbone Diagram | Business Productivity Diagramming | Using ...
- Fishbone Diagram | How to Draw a Fishbone Diagram with ...
- Using Fishbone Diagrams for Problem Solving | Cause and Effect ...
- Business Productivity Diagramming | Manufacturing 8 Ms fishbone ...
- Manufacturing 8 Ms fishbone diagram - Template | Ishikawa ...
- Fishbone Diagram | Business Productivity Diagramming | How to ...
- Fishbone Diagram | Use a Fishbone Diagram to Attack Complex ...
- Manufacturing 8 Ms fishbone diagram - Template | Ishikawa ...
- Fishbone Diagram | Cause and Effect Analysis ( Fishbone Diagrams ...
- How to Create a Fishbone (Ishikawa) Diagram Quickly | Business ...
- Fishbone Diagram | Using Fishbone Diagrams for Problem Solving ...
- Cause and Effect Analysis ( Fishbone Diagrams) | Using Fishbone ...
- Ishikawa Diagram | Manufacturing 8 Ms fishbone diagram ...
- Cause and Effect Analysis | Cause and Effect Analysis ( Fishbone ...
- Ishikawa Diagram | How to Draw a Fishbone Diagram with ...
- Lighting - Vector stencils library


