HelpDesk
How to Use a Cross - Functional Flowcharts Solution
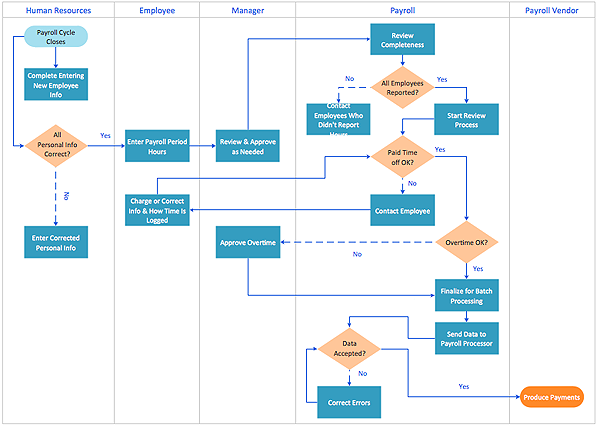
Cross-functional process is a process that involves multiple divisions, each of which makes its part of the entire company workflow. For example: product development, lead management , client orders processing – and other critical processes. Using a Cross-Functional flowchart is a clear way of showing each team member’s responsibilities and how processes get shared or transferred between different teams and departments.The Cross-Functional flowchart is a clear way to visualize the document flow in your organization. The ability to create Cross-functional diagrams is provided by the Cross-Functional Flowcharts solution.
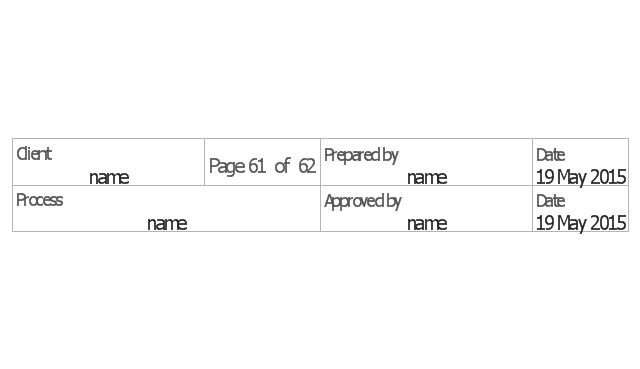
The vector stencils library "Sales flowchart" contains 62 sales process flow chart symbols.
Use these flow chart icon set to draw your sales flowcharts, workflow diagrams and process charts with the ConceptDraw PRO diagramming and vector drawing software.
The sales process flowchart symbols library "Sales flowchart" is included in the Sales Flowcharts solution from the Marketing area of ConceptDraw Solution Park.
 Cross-Functional Flowcharts
Cross-functional flowcharts are powerful and useful tool for visualizing and analyzing complex business processes which requires involvement of multiple people, teams or even departments. They let clearly represent a sequence of the process steps, the order of operations, relationships between processes and responsible functional units (such as departments or positions).
 Accounting Flowcharts
Accounting Flowcharts solution extends ConceptDraw PRO software with templates, samples and library of vector stencils for drawing the accounting flow charts.
The vector stencils library "Sales flowchart" contains 62 sales process flow chart symbols.
Use these flow chart icon set to draw your sales flowcharts, workflow diagrams and process charts with the ConceptDraw PRO diagramming and vector drawing software.
The sales process flowchart symbols library "Sales flowchart" is included in the Sales Flowcharts solution from the Marketing area of ConceptDraw Solution Park.
Use these flow chart icon set to draw your sales flowcharts, workflow diagrams and process charts with the ConceptDraw PRO diagramming and vector drawing software.
The sales process flowchart symbols library "Sales flowchart" is included in the Sales Flowcharts solution from the Marketing area of ConceptDraw Solution Park.
HelpDesk
How to Protect a ConceptDraw Document From Performing Unwanted Operations
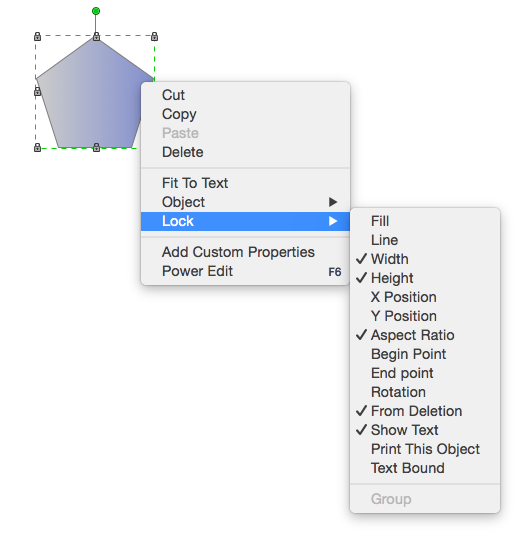
Tips on how to protect a ConceptDraw document from unwanted changes.ConceptDraw PRO gives you the possibility to prevent unexpected changes to your drawings. You can protect separate objects within the document as well as the entire document. You can protect objects from deletion, resizing or moving.HelpDesk
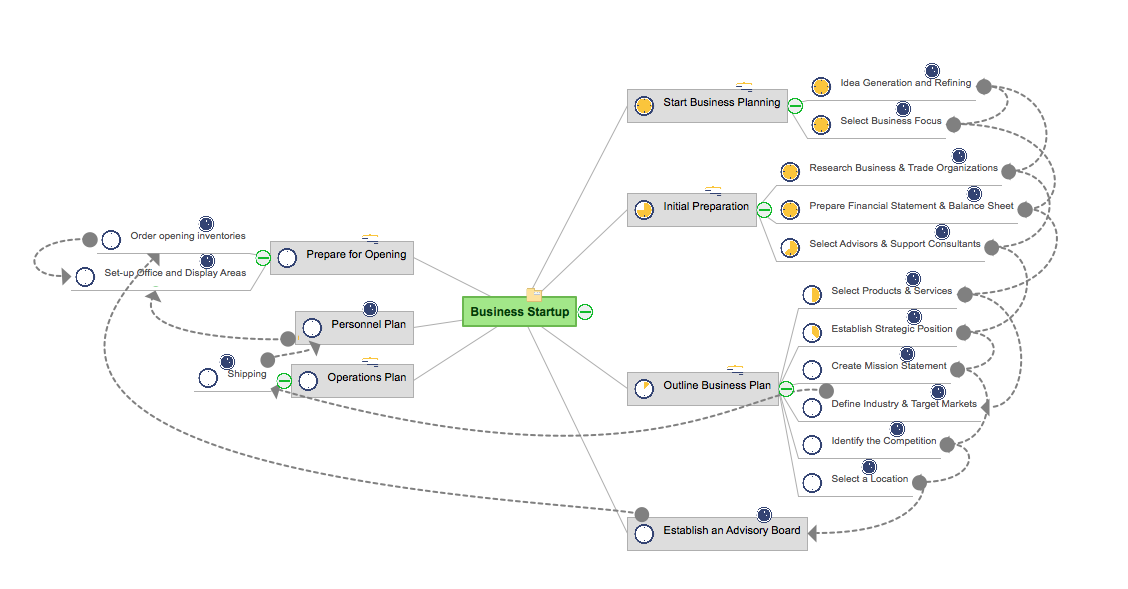
How to Create a Mind Map from Selected Tasks in Project
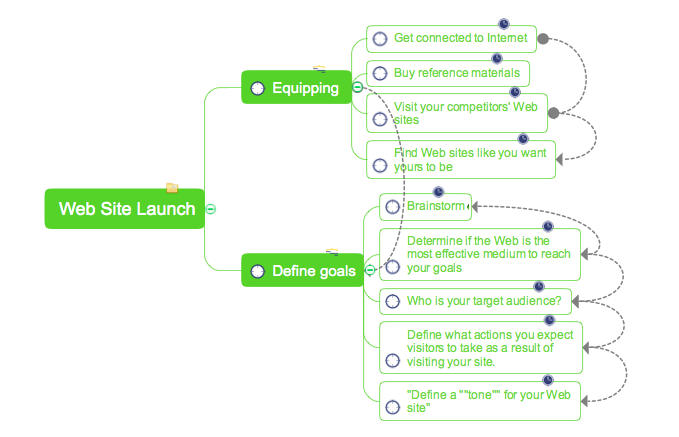
You can see the project data in a mind map structure by create a mind map from the selected project tasks.
HelpDesk
How to Create an IDEF0 Diagram for an Application Development
IDEF0 methods are intended to model the functions of a process, creating a graphical model that displays: what controls the function, who makes it, what resources are used and how they are connected with other functions. The IDEF0 tool is used to model the decisions, actions, and activities of a software system during the development process . IDEF0 diagram graphically depicts a model of a desired version of the application. ConceptDraw PRO allows you to create and communicate the IDEF0 diagrams of any complexity.HelpDesk
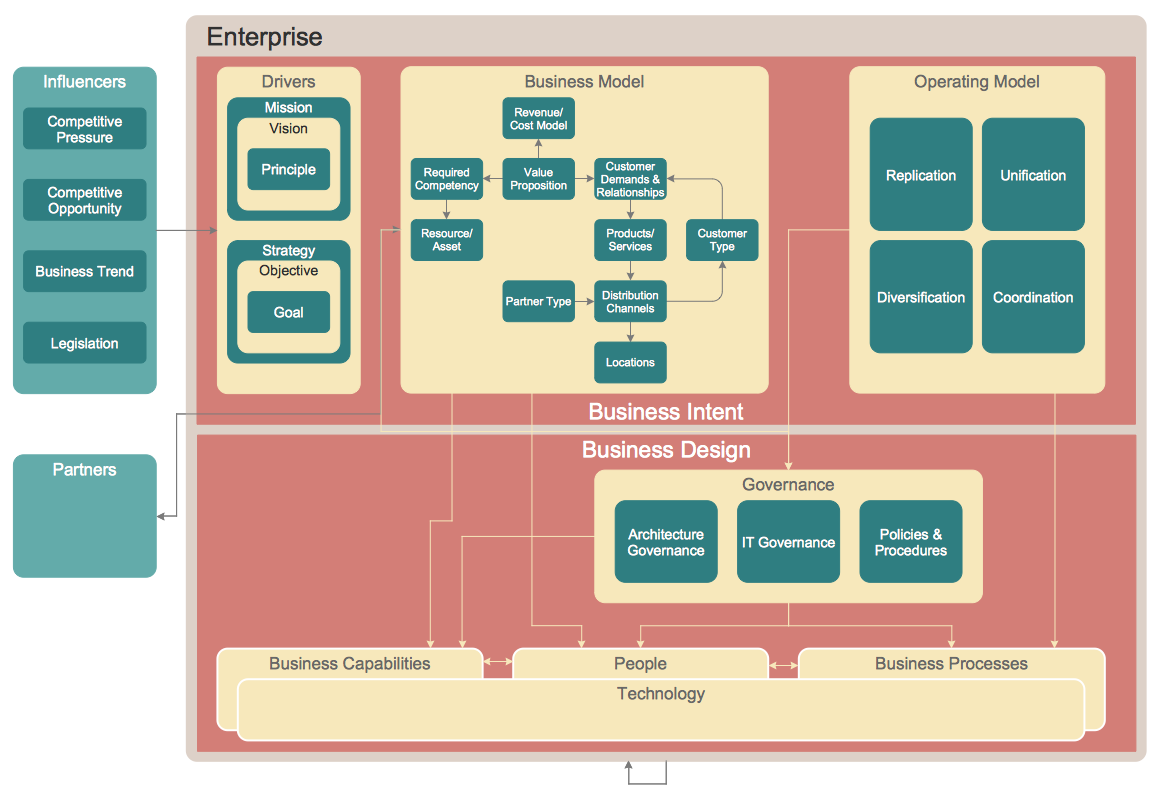
How to Create an Enterprise Architecture Diagram in ConceptDraw PRO
An Enterprise Architecture (EA) diagram is used to display the structure and operations of an organization.It is used to analyze and document an organization and its business functions, along with the applications and systems on which they are implemented. The aim of an enterprise architecture diagram is to determine how an organization can effectively achieve its current and future objectives. The Enterprise Architecture often uses diagrams to support the decision-making process. ConceptDraw PRO allows you to design Enterprise Architecture diagrams of any complexity.HelpDesk
How to Make a Mind Map from a Project Gantt Chart
ConceptDraw Office allows you to see the project data from ConceptDraw PROJECT in a mind map structure by opening your project in ConceptDraw MINDMAP.- Sales Process Flowchart . Flowchart Examples | Sales Process Steps ...
- Process Flowchart | Sales Process Flowchart . Flowchart Examples ...
- Flowchart Marketing Process. Flowchart Examples | Sales Process ...
- Sales Process Flowchart . Flowchart Examples | Marketing and Sales ...
- Sales Flowcharts | Sales Process Flowchart . Flowchart Examples ...
- Sales Process Flowchart . Flowchart Examples | Sales Flowcharts ...
- Cross-Functional Flowchart | Flowchart Software | Sales Process ...
- Sales Dashboard | Sales Process Flowchart . Flowchart Examples ...
- Flow Chart Of Designations Of Sales And Operation
- Swim Lane Diagrams | Swim Lanes Flowchart . Flowchart Examples ...
- Process Flowchart | Cross-functional flowchart - Providing telecom ...
- Work Order Process Flowchart . Business Process Mapping Examples
- Sales Process Flowchart . Flowchart Examples | Marketing and Sales ...
- Basic Flowchart Symbols and Meaning | Process Flow Chart ...
- Process Flowchart | How to Create a Bubble Diagram Using ...
- Sales Process Map | Sales Process | Sales Process Flowchart ...
- Sales Process Steps | Sales Process Flowchart . Flowchart Examples ...
- Sales Process Flowchart . Flowchart Examples | Sales Process ...
- Sales Process Flowchart . Flowchart Examples | The Sales Process ...
- Process Flowchart | Basic Flowchart Symbols and Meaning ...

-sales-flowchart---vector-stencils-library.png--diagram-flowchart-example.png)
-sales-flowchart---vector-stencils-library.png--diagram-flowchart-example.png)

-sales-flowchart---vector-stencils-library.png--diagram-flowchart-example.png)

-sales-flowchart---vector-stencils-library.png--diagram-flowchart-example.png)
-sales-flowchart---vector-stencils-library.png--diagram-flowchart-example.png)

-sales-flowchart---vector-stencils-library.png--diagram-flowchart-example.png)






-sales-flowchart---vector-stencils-library.png--diagram-flowchart-example.png)

-sales-flowchart---vector-stencils-library.png--diagram-flowchart-example.png)























-sales-flowchart---vector-stencils-library.png--diagram-flowchart-example.png)
-sales-flowchart---vector-stencils-library.png--diagram-flowchart-example.png)


