 Total Quality Management TQM Diagrams
Total Quality Management Diagrams solution extends ConceptDraw DIAGRAM software with samples, templates and vector stencils library for drawing the TQM flowcharts.
HelpDesk
How to Create a TQM Diagram Using Total Quality Management Diagrams Solution

Create TQM Flowcharts for Mac

TQM Software — Build Professional TQM Diagrams

The Fifty Two Elements of TQM
"Classic TQM Tools ...
Flow Charts Pictures, symbols or text coupled with lines, arrows on lines show direction of flow. Flowcharting enables
modeling of processes; problems/ opportunities and decision points etc. It develops a common understanding of a process by those in
volved." [whaqualitycenter.org/ Portals/ 0/ Tools%20 to%20 Use/ Classic%20 Quality%20 Tools/ Classic%20 TQM%20 Tools%20 R%20 2-12.pdf]
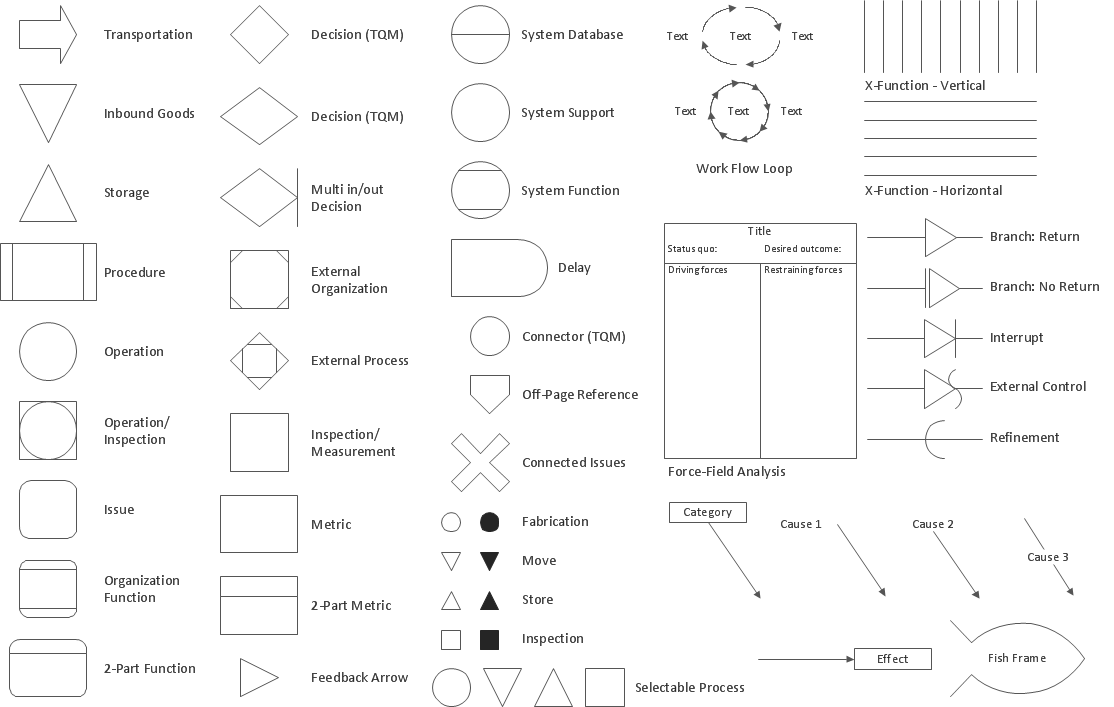
The vector stencils library TQM diagrams contains 58 symbols for drawing total quality management (TQM) flow charts using the ConceptDraw PRO diagramming and vector drawing software.
The example "Design elements - TQM diagram" is included in the Total Quality Management (TQM) Diagrams solution from the Quality area of ConceptDraw Solution Park.
Flow Charts Pictures, symbols or text coupled with lines, arrows on lines show direction of flow. Flowcharting enables
modeling of processes; problems/ opportunities and decision points etc. It develops a common understanding of a process by those in
volved." [whaqualitycenter.org/ Portals/ 0/ Tools%20 to%20 Use/ Classic%20 Quality%20 Tools/ Classic%20 TQM%20 Tools%20 R%20 2-12.pdf]
The vector stencils library TQM diagrams contains 58 symbols for drawing total quality management (TQM) flow charts using the ConceptDraw PRO diagramming and vector drawing software.
The example "Design elements - TQM diagram" is included in the Total Quality Management (TQM) Diagrams solution from the Quality area of ConceptDraw Solution Park.
TQM flow chart symbols

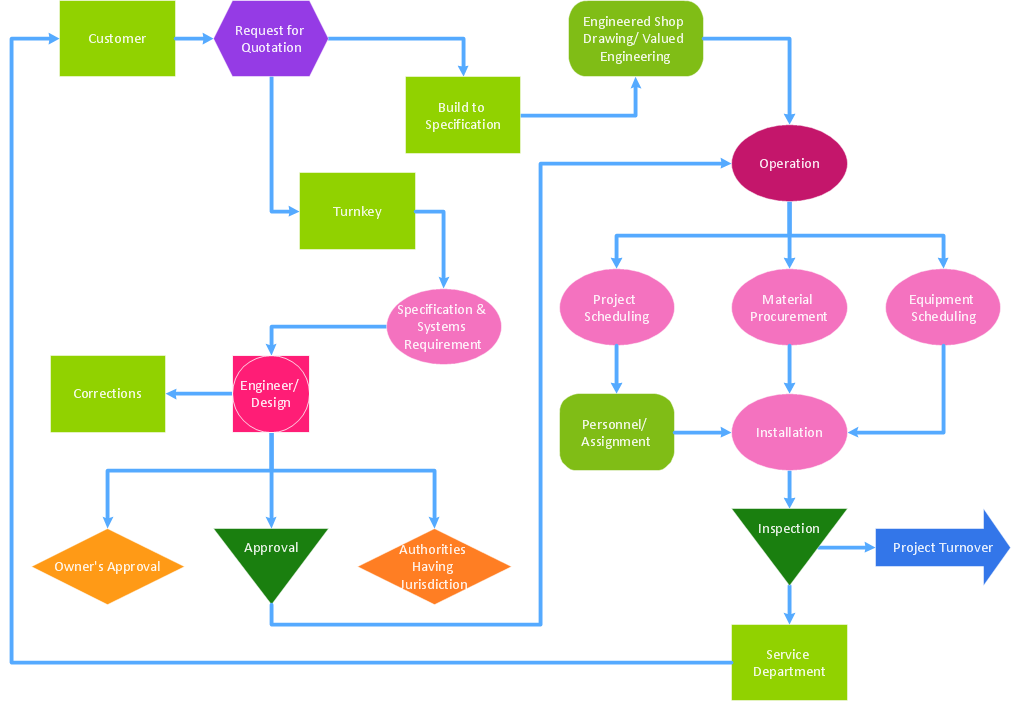
TQM Diagram Example

A Study of the Business Value of Total Quality Management
Total Quality Management Value

Management Tools — Total Quality Management

Probability Quality Control Tools

Definition TQM Diagram

TQM Diagram — Professional Total Quality Management

TQM Diagram Tool

Business Diagram Software


Total Quality Management Definition

Identifying Quality Management System

Total Quality Management Density

"The Process Flow Chart provides a visual representation of the steps in a process. ...
When to Use:
One of the first activities of a process improvement effort is constructing a flowchart. It provides the following benefits:
1- It give you and everyone a clear understanding of the process.
2- Facilitates teamwork and communication.
3- Helps to identify non-value-added operations."
[bexcellence.org/ Flow-Chart.html]
This TQM diagram example shows a business process that can be then analyzed to improve the effectiveness and diagnose quality issues that require resolution.
This example was created using the ConceptDraw PRO diagramming and vector drawing software extended with the Total Quality Management (TQM) Diagrams solution from the Quality area of ConceptDraw Solution Park.
TQM diagram

- Total Quality Management TQM Diagrams | TQM Diagram Example ...
- Total Quality Management TQM Diagrams | TQM Diagram Example ...
- Design elements - TQM diagram | Total Quality Management TQM ...
- Total Quality Management TQM Diagrams | Block diagram - Gap ...
- Total Quality Management TQM Diagrams | How to Create a TQM ...
- TQM Software — Build Professional TQM Diagrams | How to Create ...
- Flowchart - HR management process | TQM Software — Build ...
- Cross-Functional Flowcharts | TQM Software — Build Professional ...
- Total Quality Management TQM Diagrams | The Fifty Two Elements ...
- TQM Diagram — Professional Total Quality Management | Good ...
- Engineering | Process Flowchart | Total Quality Management TQM ...
- TQM Software — Build Professional TQM Diagrams
- Total Quality Management TQM Diagrams | Total Quality ...
- How to Create a TQM Diagram Using Total Quality Management ...
- Probability Quality Control Tools | TQM Diagram Tool | TQM Diagram
- Quality Area | Lean Manufacturing Diagrams | TQM Diagram Tool ...
- TQM Diagram Example | Total Quality Management TQM Diagrams ...
- Total Quality Management TQM Diagrams | Create TQM Flowcharts ...
- Total Quality Management TQM Diagrams | Event-driven Process ...
- Basic Flowchart Symbols and Meaning | Flowchart design ...