Lean Manufacturing Diagrams
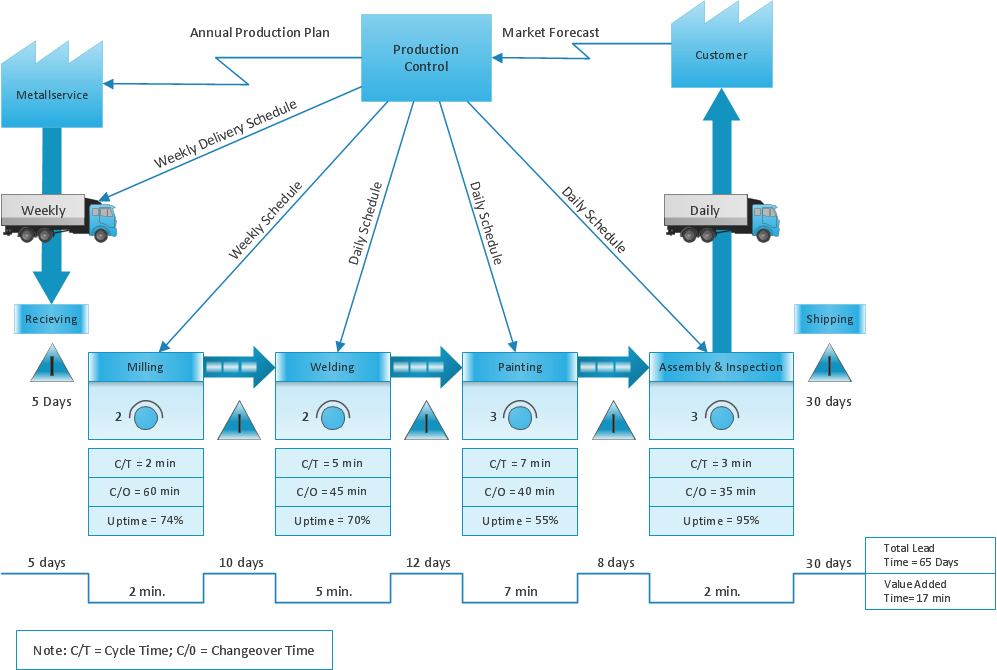
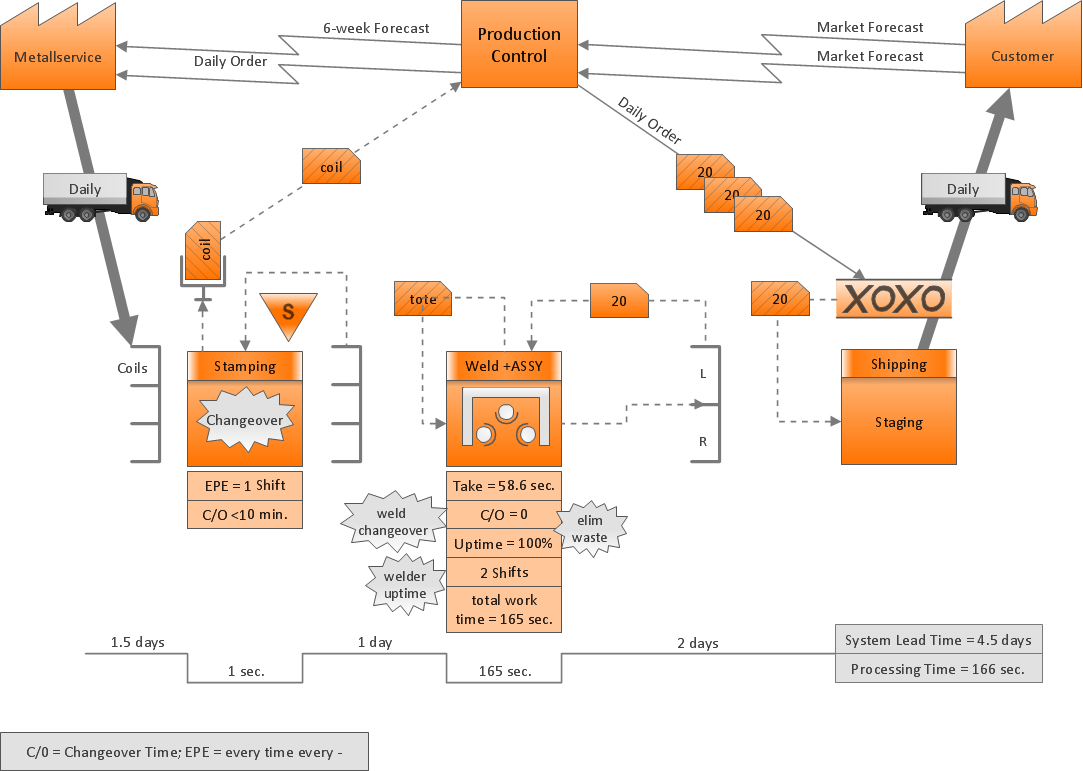
The Value Stream Mapping solution continues to extend the range of ConceptDraw PRO into a business graphics tool that can be used to document processes of Lean Manufacturing.Lean Value Stream Map
Lean Manufacturing tool is a new Value Stream Mapping solution found in the ConceptDraw Solution Park.Lean Value Stream
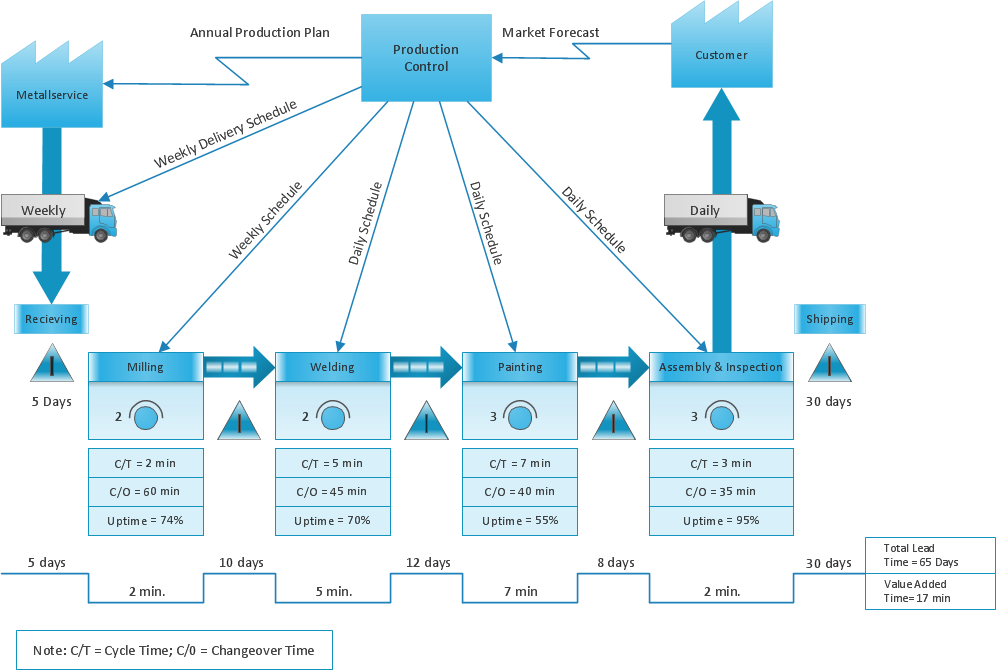
ConceptDraw Value Stream Mapping is a Lean Manufacturing tool that uses a flow diagram to document in great detail every step of a manufacturing process.Value-Stream Mapping for Manufacturing
Create value stream maps - for value stream analysis and value stream management, material and information flow mapping, using our quick start templates included with ConceptDraw.Create a Value Stream Map
Use ConceptDraw PRO software extended with Value Stream Mapping solution to create your own VSM diagrams.
 Value Stream Mapping
Value stream mapping solution extends ConceptDraw PRO software with templates, samples and vector stencils for drawing the Value Stream Maps (VSM) in lean manufacturing practice.
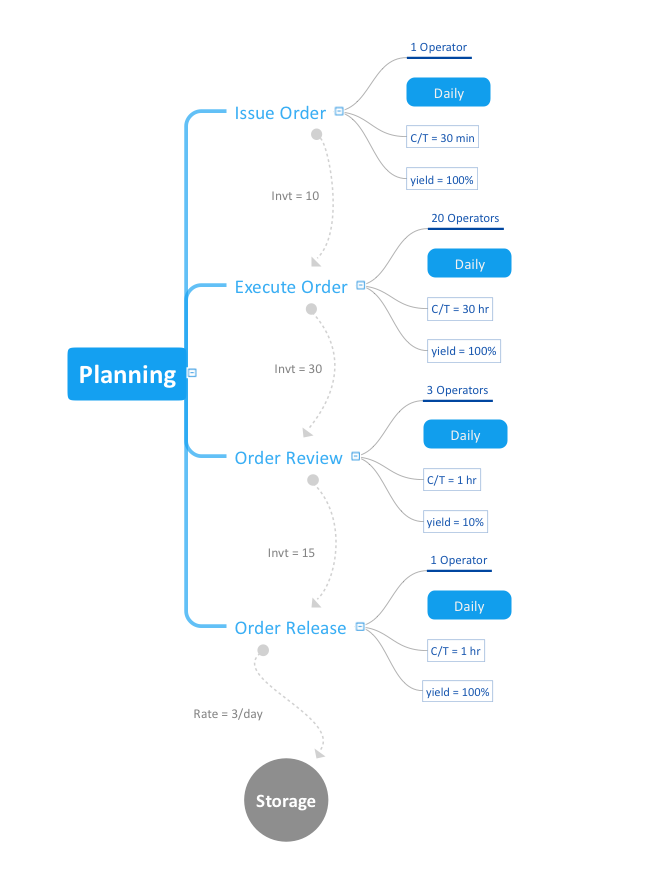
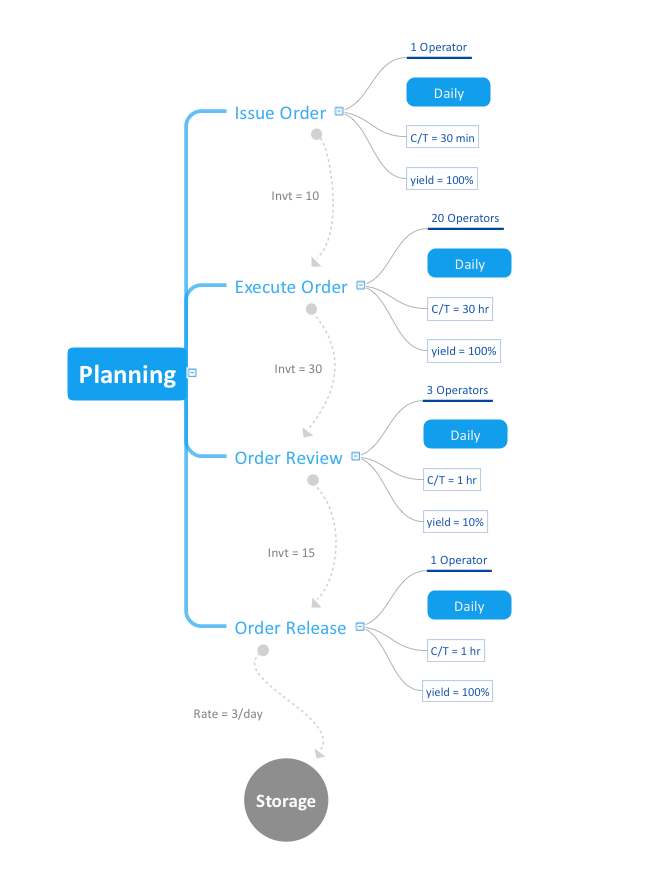
Value Stream Mapping for the Lean Office
Value Stream Mapping for the lean office is a tool that uses a flow diagram to document in great detail every step of a manufacturing process.It helps to bring out the best in your products and services
Using ConceptDraw you can describe your own quality processes, brainstorm, and structure quality issues.Learn how to create a current state value stream map
Value Stream Mapping solution extends ConceptDraw PRO software with templates, samples and vector shapes for drawing the current state value stream maps.Mind Mapping in the Quality Management
ConceptDraw MINDMAP has a addition to the ConceptDraw Solution Park that provides a creative approach to visualizing quality processes, Quality Mind Map Solution.Quality Mind Map Solution
The Quality Mind Map Solution extends ConceptDraw MINDMAP with the addition of a number of Quality Management Mind Maps (Presentations, Meeting Agendas, and problem-solving techniques).What is Value Stream Mapping?
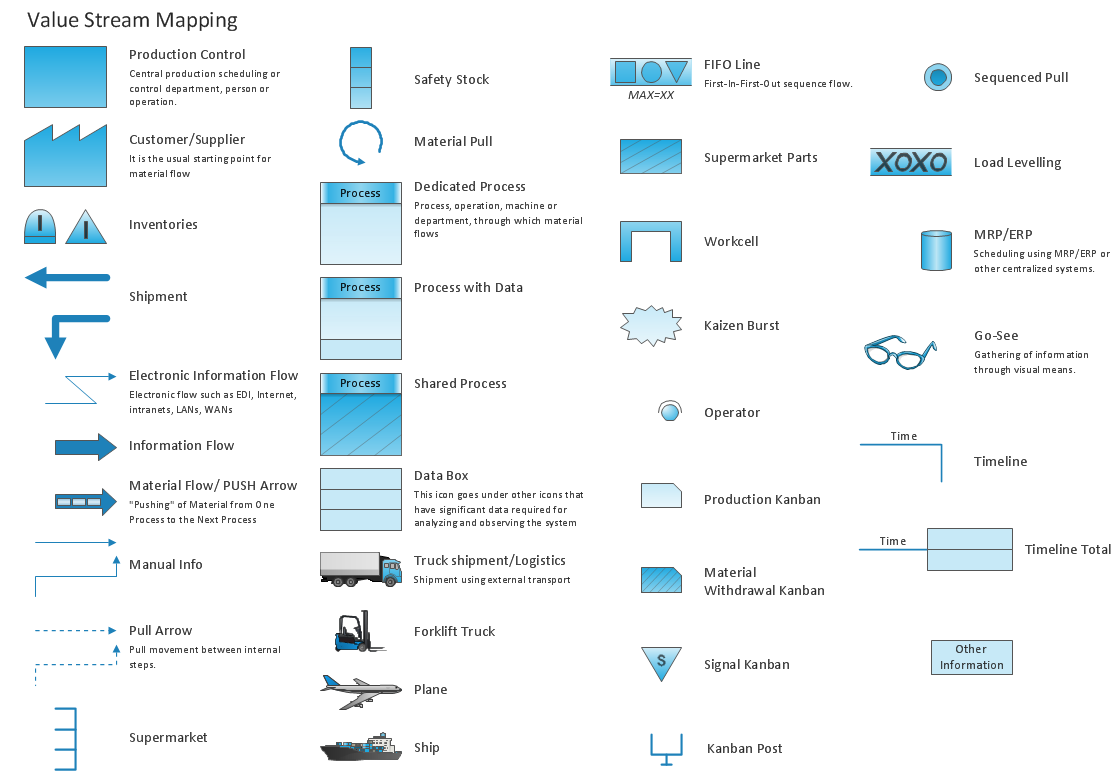
Value stream maps (VSM) are an essential tool for organizations applying Lean methods.Value Stream Mapping Icons
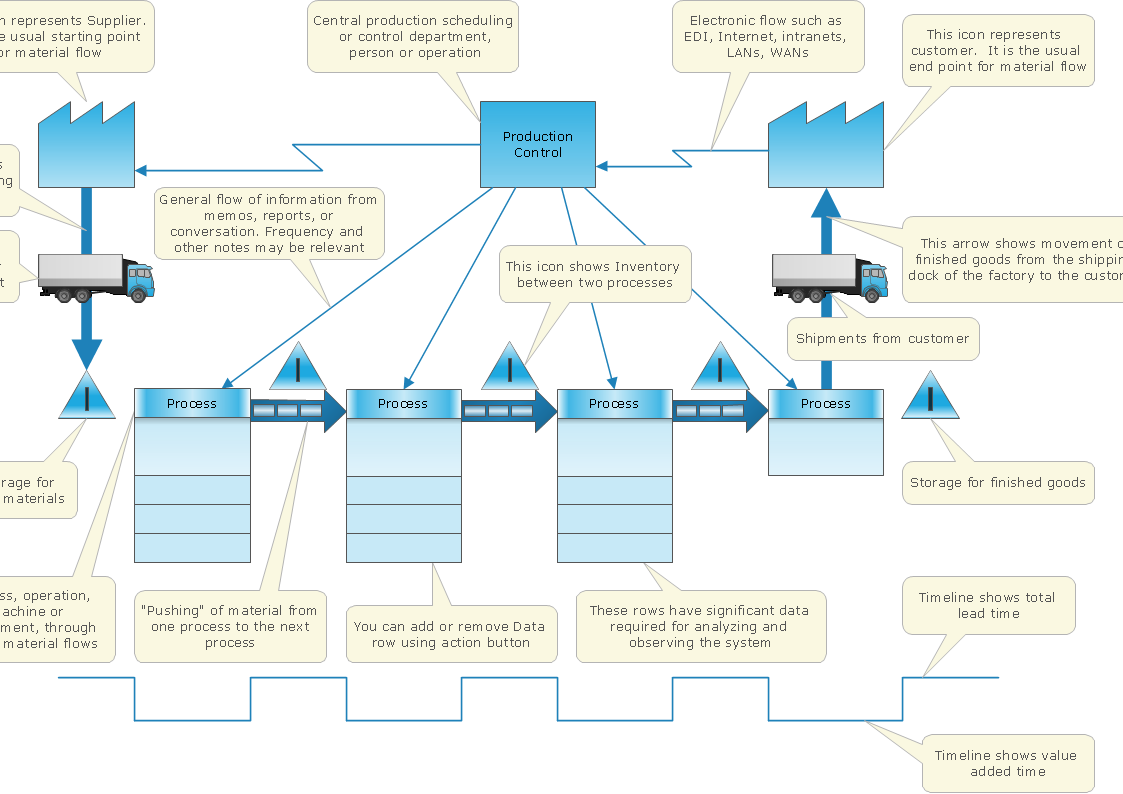
The library with 40 vector stencils is included in the ConceptDraw Value Stream Mapping solution.Quality Engineering Diagrams
Create value stream maps - for value stream analysis and value stream management, material and information flow mapping, using our quick start templates included with ConceptDraw.Value Stream Diagram
The new Value Stream Mapping solution found in the ConceptDraw Solution Park continues to extend the range of ConceptDraw PRO into a business graphics tool.Value Stream Mapping - Design Elements
ConceptDraw PRO is a software for making Value Stream Mapping diagram with more than 10 library objects that are scalable vector images.Purposes of a Value Stream Management Tool
ConceptDraw Value Stream Maps visualize for a manufacturing plant the material and information flow required to deliver a product/service to customers.
 Quality Mind Map
This solution extends ConceptDraw MINDMAP software with Quality Management Mind Maps (Presentations, Meeting Agendas, Problem to be solved).
Value Stream Analysis
ConceptDraw Value Stream Maps are used in lean practice for analysis of manufacturing processes to identify the improvement opportunities.- Value stream with ConceptDraw PRO | Lean Manufacturing ...
- Quality Area | Lean Manufacturing Diagrams | TQM Diagram Tool |
- Total Quality Management TQM Diagrams | Fishbone Diagram ...
- Manufacturing and Maintenance | Business Productivity ...
- Fishbone Diagram | Manufacturing and Maintenance | Value Stream ...
- Lean Value Stream Map
- Root Cause Analysis tree diagram - Manufacturing problem solution | Seven ...
- Seven Management and Planning Tools | TQM Diagram Example ...
- Lean Manufacturing Diagrams | Fishbone Diagram | Manufacturing ...
- Launch Projects Exchanging Mind Maps with Evernote | How to ...
- Seven Management and Planning Tools | Business Productivity ...
- Seven Management and Planning Tools | Business Productivity Area |
- Great value in depicting and describing a problem in detail | Quality ...
- Fishbone Diagram | Business Productivity Area | Business diagrams ...
- How To Create Emergency Plans | Fishbone Diagram | Create a ...
- Root Cause Analysis tree diagram - Manufacturing problem solution ...
- Seven Management and Planning Tools | PROBLEM ANALYSIS ...
- Seven Management and Planning Tools | Affinity diagram - Personal ...
- Total Quality Management TQM Diagrams | Seven Management and ...
- Seven Management and Planning Tools | Business Productivity ...

