 PM Teams
This solution extends ConceptDraw Office 2.0 products with a single information space for messaging to teams.
 Management
This solution extends ConceptDraw DIAGRAM and ConceptDraw MINDMAP with Management Diagrams and Mind Maps (decision making, scheduling, thinking ideas, problem solving, business planning, company organizing, SWOT analysis, preparing and holding meetings
Business diagrams & Org Charts with ConceptDraw DIAGRAM


 Project Management Area
Project Management area provides Toolbox solutions to support solving issues related to planning, tracking, milestones, events, resource usage, and other typical project management functions.
 Organizational Charts
Organizational Charts solution extends ConceptDraw DIAGRAM software with samples, templates and library of vector stencils for drawing the org charts.
How To Plan and Implement Projects Faster

 PM Presentations
The PM Presentations solution extends the power of ConceptDraw MINDMAP , ConceptDraw DIAGRAM , and ConceptDraw PROJECT, improving their efficiency at many stages of the project management process by using the same source data to construct the targeted presentation for your audience and clearly communicating the appropriate information to different audiences from a single source. It gives an ability to project managers and other team participants to create and to deliver capacious presentations representing the data and knowledge of a specific project with the help of including visual dashboards, Gantt charts, resource views, maps, timelines, calendars, illustrations, project diagrams and reports of varied types. Having the possibility to edit collaboratively in a Full-Screen Mode, the teams can rapidly plan a project as well as execute the tasks of revising and making changes to it.
Software development with ConceptDraw products

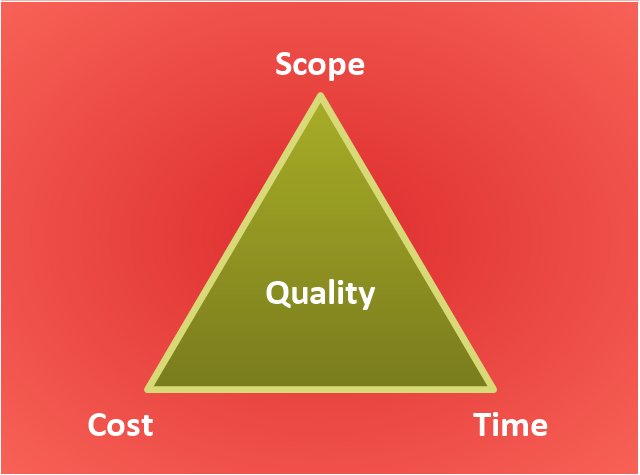
"The Project Management Triangle (called also Triple Constraint or the Iron Triangle) is a model of the constraints of project management. It is a graphic aid where the three attributes show on the corners of the triangle to show opposition. It is useful to help with intentionally choosing project biases, or analyzing the goals of a project. It is used to illustrate that project management success is measured by the project team's ability to manage the project, so that the expected results are produced while managing time and cost." [Project management triangle. Wikipedia]
The pyramid chart example "Project management triangle diagram" was redesigned using the ConceptDraw PRO diagramming and vector drawing software from Wikimedia Commons file Project-triangle-en.svg. [commons.wikimedia.org/ wiki/ File:Project-triangle-en.svg]
The project management triangle chart example is included in the Pyramid Diagrams solution from the Marketing area of ConceptDraw Solution Park.
Pyramid diagram
- How to Draw an Organization Chart | Gant Chart in Project ...
- Gant Chart in Project Management | What Constitutes a Project ...
- Gantt charts for planning and scheduling projects | Gant Chart in ...
- Gant Chart in Project Management | Project Working With Costs ...
- Gantt charts for planning and scheduling projects | Gant Chart in ...
- Gant Chart in Project Management | Project Working With Costs ...
- Pyramid Diagram | Gantt charts for planning and scheduling projects ...
- Good Flow Chart app for Mac | Audit flowchart - Project management ...
- Gant Chart in Project Management | Gantt charts for planning and ...
- Gant Chart in Project Management |
- PM Easy | Workflow Diagram Software Mac | Business Productivity ...
- Gant Chart in Project Management
- How to draw a Cross-Functional Flowchart | Cross-Functional ...
- Gant Chart in Project Management
- Business Diagram Software | PM Easy | Business diagrams & Org ...
- Picture Graphs | Picture graph template | Design elements - Picture ...
- Social Media Response Management Charts - software tools ...
- Project management
- How To Create Project Report | Gantt charts for planning and ...
- ConceptDraw PRO - Organizational chart software | Organizational ...