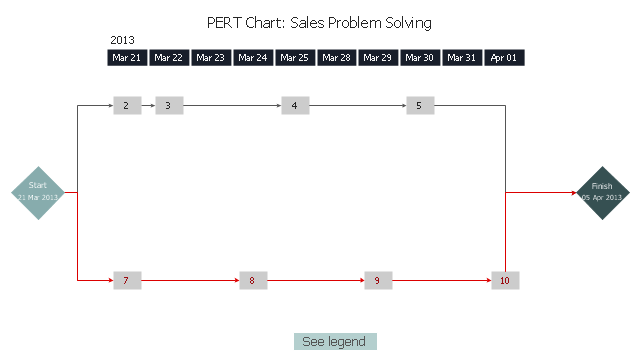
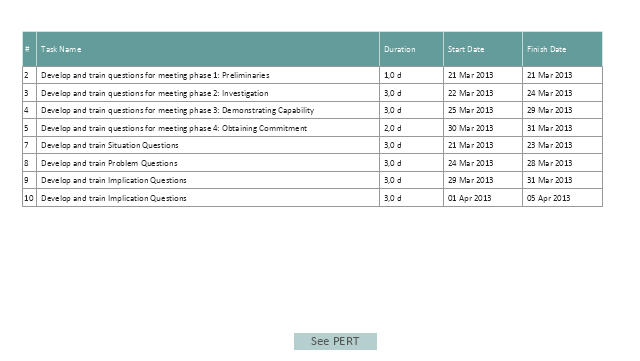
This example was created using ConceptDraw PRO diagramming and vector drawing software extended with Seven Management and Planning Tools solution from Management area of ConceptDraw Solution Park. https:/ / www.conceptdraw.com/ solution-park/ management-seven-mp-tools
CORRECTIVE ACTIONS PLANNING PERT Chart
Provide comprehensive visual tools for problem analysis.
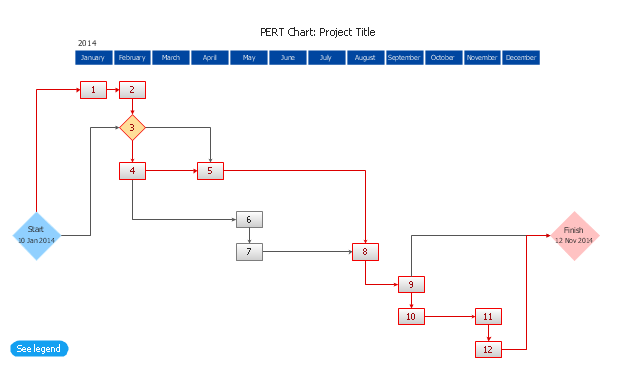
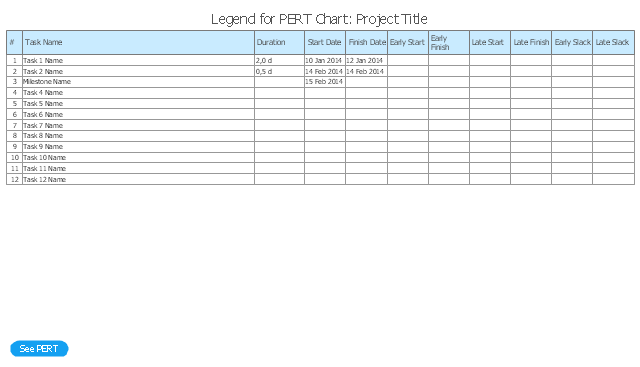
This template for ConceptDraw PRO diagramming and vector drawing software is included in the Seven Management and Planning Tools solution from Management area of ConceptDraw Solution Park. https:/ / www.conceptdraw.com/ solution-park/ management-seven-mp-tools
The PERT Chart shows the logical connections and consequence of a set of tasks. PERT charts the time period for problem solving and the implementation plan for all activities along the critical path. The PERT Chart is also known as a Precedence Diagram or Project Network Diagram.
 Seven Management and Planning Tools
Seven Management and Planning Tools solution extends ConceptDraw PRO and ConceptDraw MINDMAP with features, templates, samples and libraries of vector stencils for drawing management mind maps and diagrams.
Decision Making
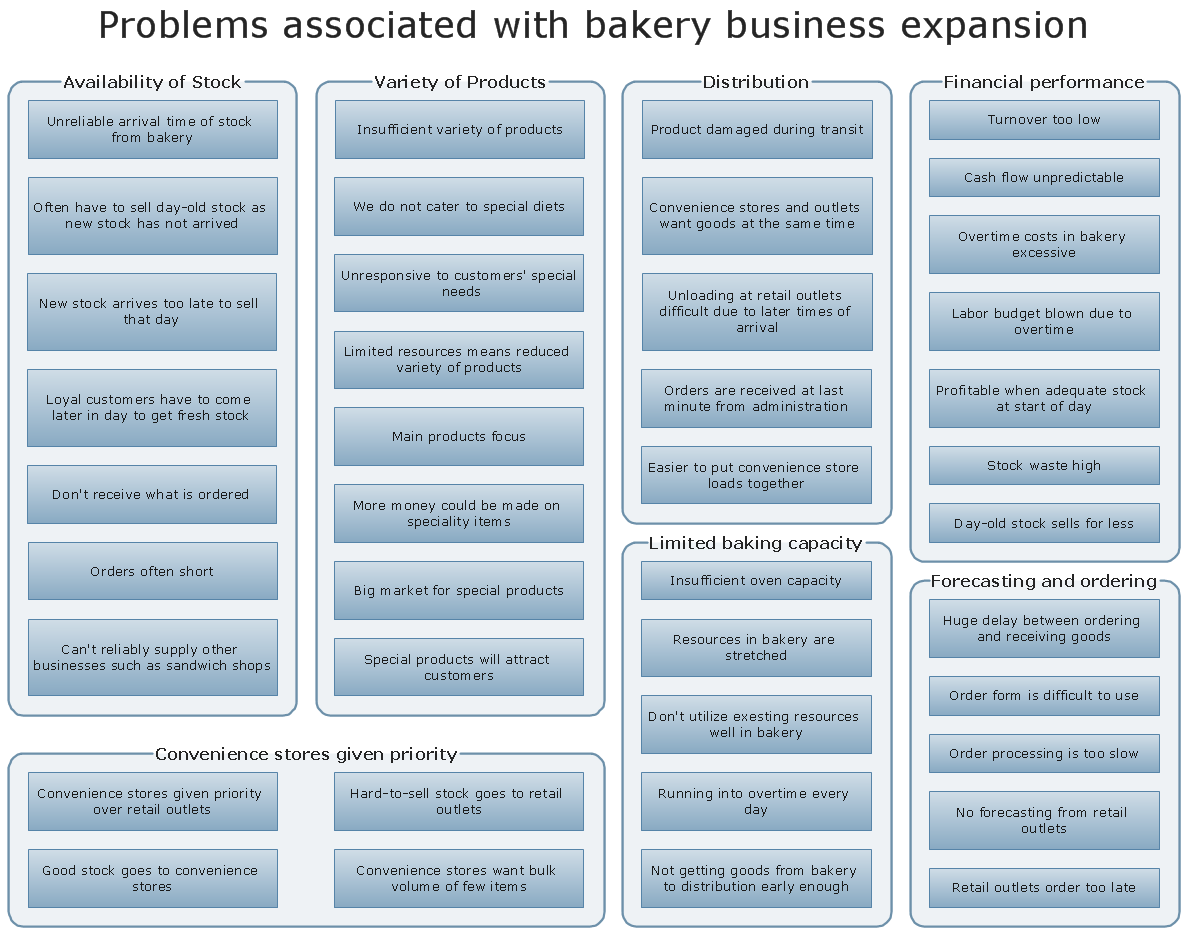
Problem analysis. Affinity Diagram, Gather and structure factors. Create Affinity Diagram using ConceptDraw PRO.
The Action Plan
In practice, the management team makes a decision on a problem in two stages. The first stage is problem analysis and the second stage is action planning.
CORRECTIVE ACTIONS PLANNING Risk Diagram (PDPC)
Risk Diagram (PDPC). Analyze problem solving risks and propose preventive actions.
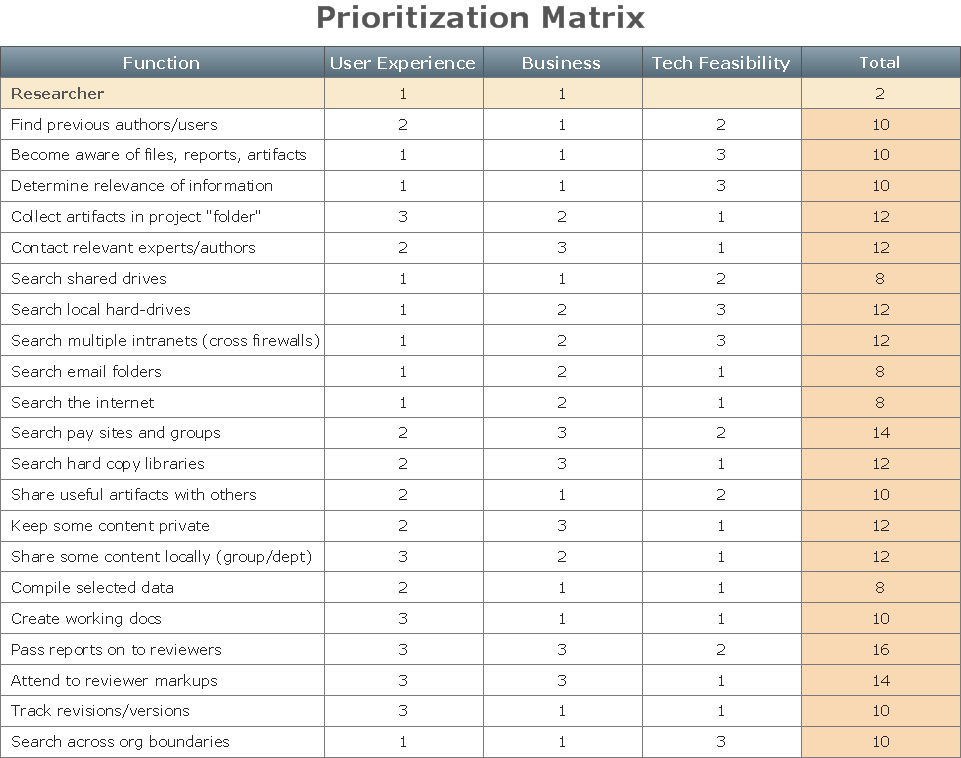
PROBLEM ANALYSIS Prioritization Matrix
Create Prioritization Matrix. Use the Prioritization Matrix to define factor priority.
PROBLEM ANALYSIS Identify and Structure Factors
Identify and Structure Factors.Use the Affinity Diagram to collect and structure factors that impact on a problem.
PROBLEM ANALYSIS Relations Diagram
Analyze Factors Relations. Use the Relations Diagram to create a relations factors map and to identify which factors are “drivers” and “indicators”.
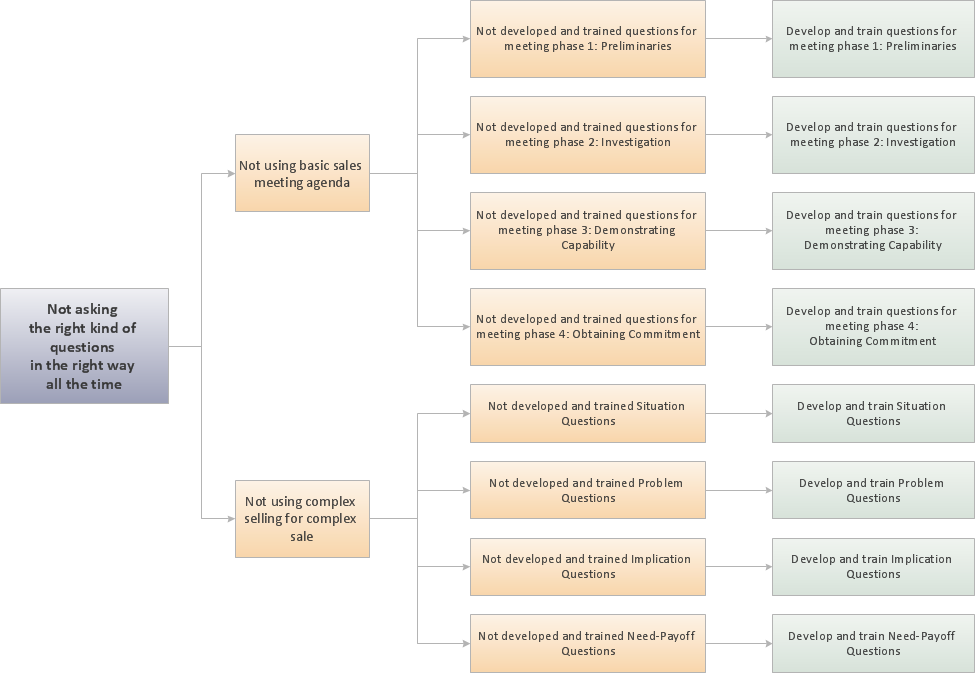
PROBLEM ANALYSIS Root Cause Analysis tree Diagram
Root Cause Analysis tree Diagram. Use the Root Cause Diagram to perform visual root cause analysis.
Risk Analysis
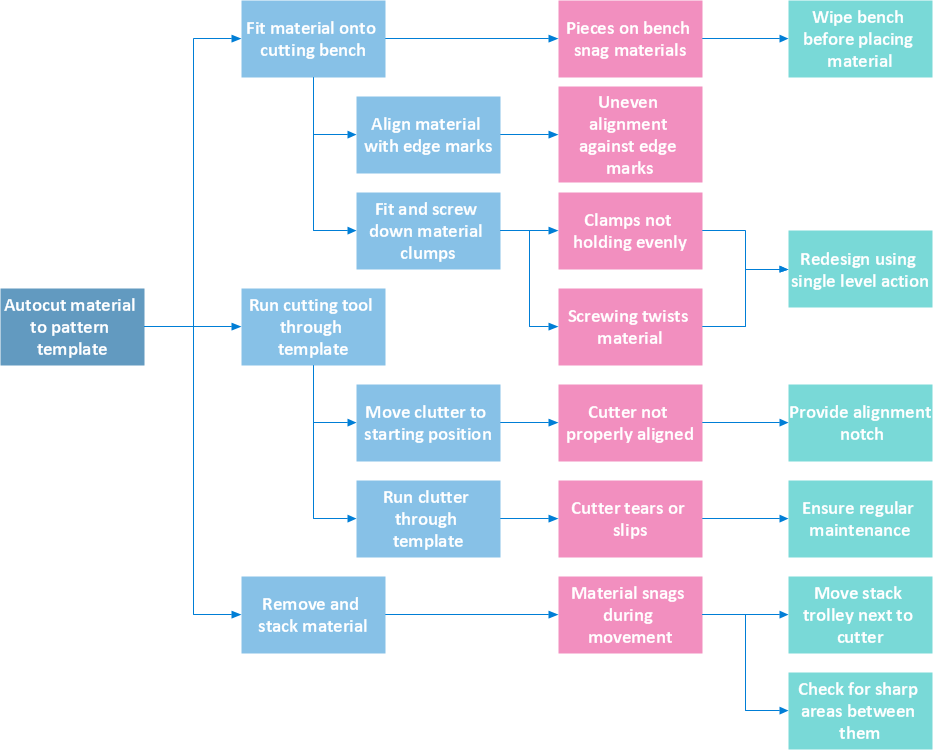
Risks Diagram. This diagram identifies possible risks in accomplishing corrective actions.
Root Cause Analysis
Root Cause Analysis tree Diagram. This diagram is for Root Cause Analysis. Analyze the root causes for factors that influenced the problem using ConceptDraw.
Problem Analysis
Use ConceptDraw PRO for step-by-step analysis of problems and to plan corrective actions.
Corrective Action Planning
One of the stages of the problem's solving process scenario is Corrective Action Planning.
Cause & Effect Analysis
Root Cause Analysis tree Diagram. Use the Root Cause Diagram to perform visual root cause analysis.
- Program Evaluation and Review Technique ( PERT ) with ...
- Seven Management and Planning Tools | CORRECTIVE ACTIONS ...
- CORRECTIVE ACTIONS PLANNING PERT Chart | Corrective Action ...
- Program Evaluation and Review Technique ( PERT ) with ...
- CORRECTIVE ACTIONS PLANNING PERT Chart | CORRECTIVE ...
- Corrective Action Planning
- CORRECTIVE ACTIONS PLANNING PERT Chart | Corrective Action ...
- Seven Management and Planning Tools | Seven Management and ...
- CORRECTIVE ACTIONS PLANNING PERT Chart | How To ...
- Gant Chart in Project Management | Project Working With Costs ...
- PM Easy | Program Evaluation and Review Technique ( PERT ) with ...
- Project Task Trees and Dependencies | PROBLEM ANALYSIS ...
- Affinity diagram template | Affinity diagram - Personal activity ...
- Cause and Effect Analysis (Fishbone Diagrams ) | Using Fishbone ...
- PM Easy | Management | Project †Working With Costs |
- Cause & Effect Analysis | PROBLEM ANALYSIS Root Cause Analysis tree ...
- Program Evaluation and Review Technique ( PERT ) with ...
- Root Cause Analysis tree diagram template | Fault Tree Diagram | Cause ...
- Seven Management and Planning Tools | PROBLEM ANALYSIS ...
- PROBLEM ANALYSIS Root Cause Analysis tree Diagram | Root Cause Analysis tree
