 ConceptDraw Solution Park
ConceptDraw Solution Park collects graphic extensions, examples and learning materials
HelpDesk
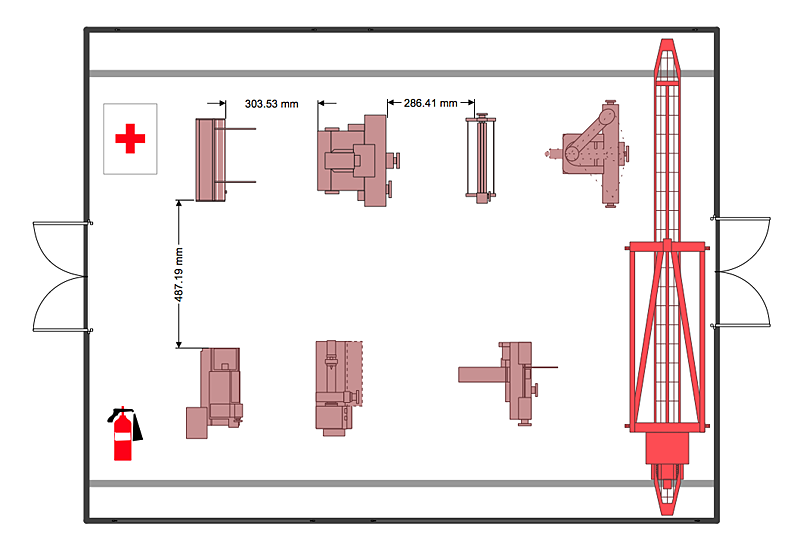
How to Create a Plant Layout Design
A plant construction process begins from a plant layout stage - an engineering stage used to design, analyze and finally choose the suitable configurations for a manufacturing plant. Plant Layout issues are core to any enterprise and are challenged in all types of manufacturing process. The sufficiency of layout influences the efficiency of subsequent operations.It is an important background for efficient manufacturing and also has a great deal with many questions. Once the place of the plant has been determined, the next important task before the management of the plant is to plan appropriate layout for the enterprise.
Plant layout is used to create the most effective physical arrangement of machinery and equipment, with the plant building in such a manner so as to make quickest and cheapest way from a raw material to the shipment of the completed product
Making a plan that shows the location of industrial equipment involves many different elements that can be managed using Con
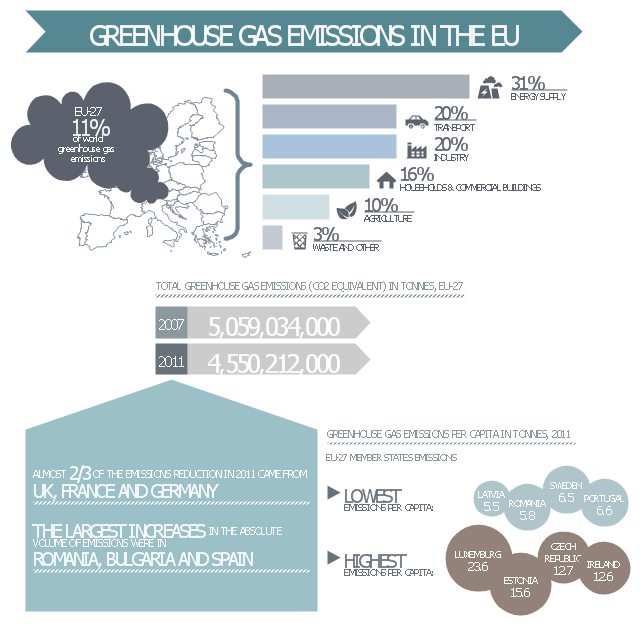
This ecology infographic example was created on the base of the infographics "Greenhouse gas emissions in the EU" from the Debating Europe website. [debatingeurope.eu/ wp-content/ uploads/ 2013/ 06/ TH_ 2_ social.png]
"A greenhouse gas (sometimes abbreviated GHG) is a gas in an atmosphere that absorbs and emits radiation within the thermal infrared range. This process is the fundamental cause of the greenhouse effect. The primary greenhouse gases in the Earth's atmosphere are water vapor, carbon dioxide, methane, nitrous oxide, and ozone. Greenhouse gases greatly affect the temperature of the Earth; without them, Earth's surface would average about 33 °C colder, which is about 59 °F below the present average of 14 °C (57 °F)." [Greenhouse gas. Wikipedia]
The ecology infographic example "EU greenhouse gas emissions" was created using the ConceptDraw PRO diagramming and vector drawing software extended with the Management Infographics solition from the area "Business Infographics" in ConceptDraw Solution Park.
Used Solutions
 Soccer
The Soccer (Football) Solution extends ConceptDraw PRO v9.5 (or later) software with samples, templates, and libraries of vector objects for drawing soccer (football) diagrams, plays schemas, and illustrations. It can be used to make professional looking
HelpDesk
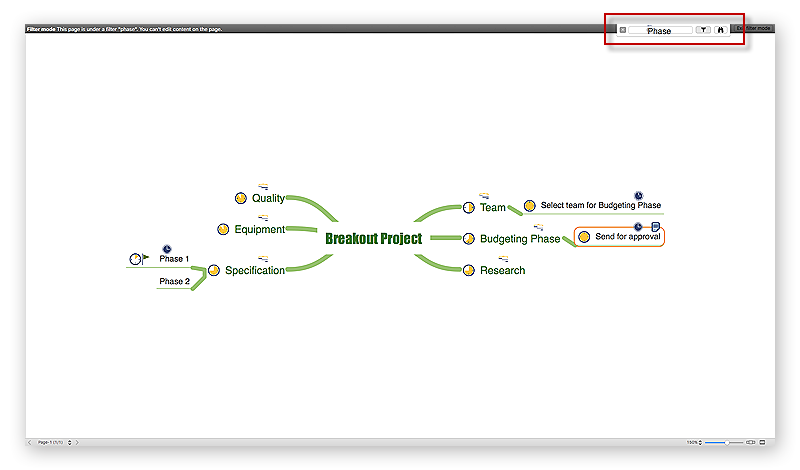
How to Use Mind Map Filtering in ConceptDraw MINDMAP
Many of us use mind maps for organizing, structuring or compiling our ideas or projects. Making mind map is the ability to take existing ideas and combine them in new ways. This is much easier to do when you can see all the ideas in front of you. Using mind maps for organizing and structuring information as the volume of data grows and the map expands can be a challenge. ConceptDraw MINDMAP allows you to sort and filter your mind map content even on the Full Screen.Audio Visual Connectors Types
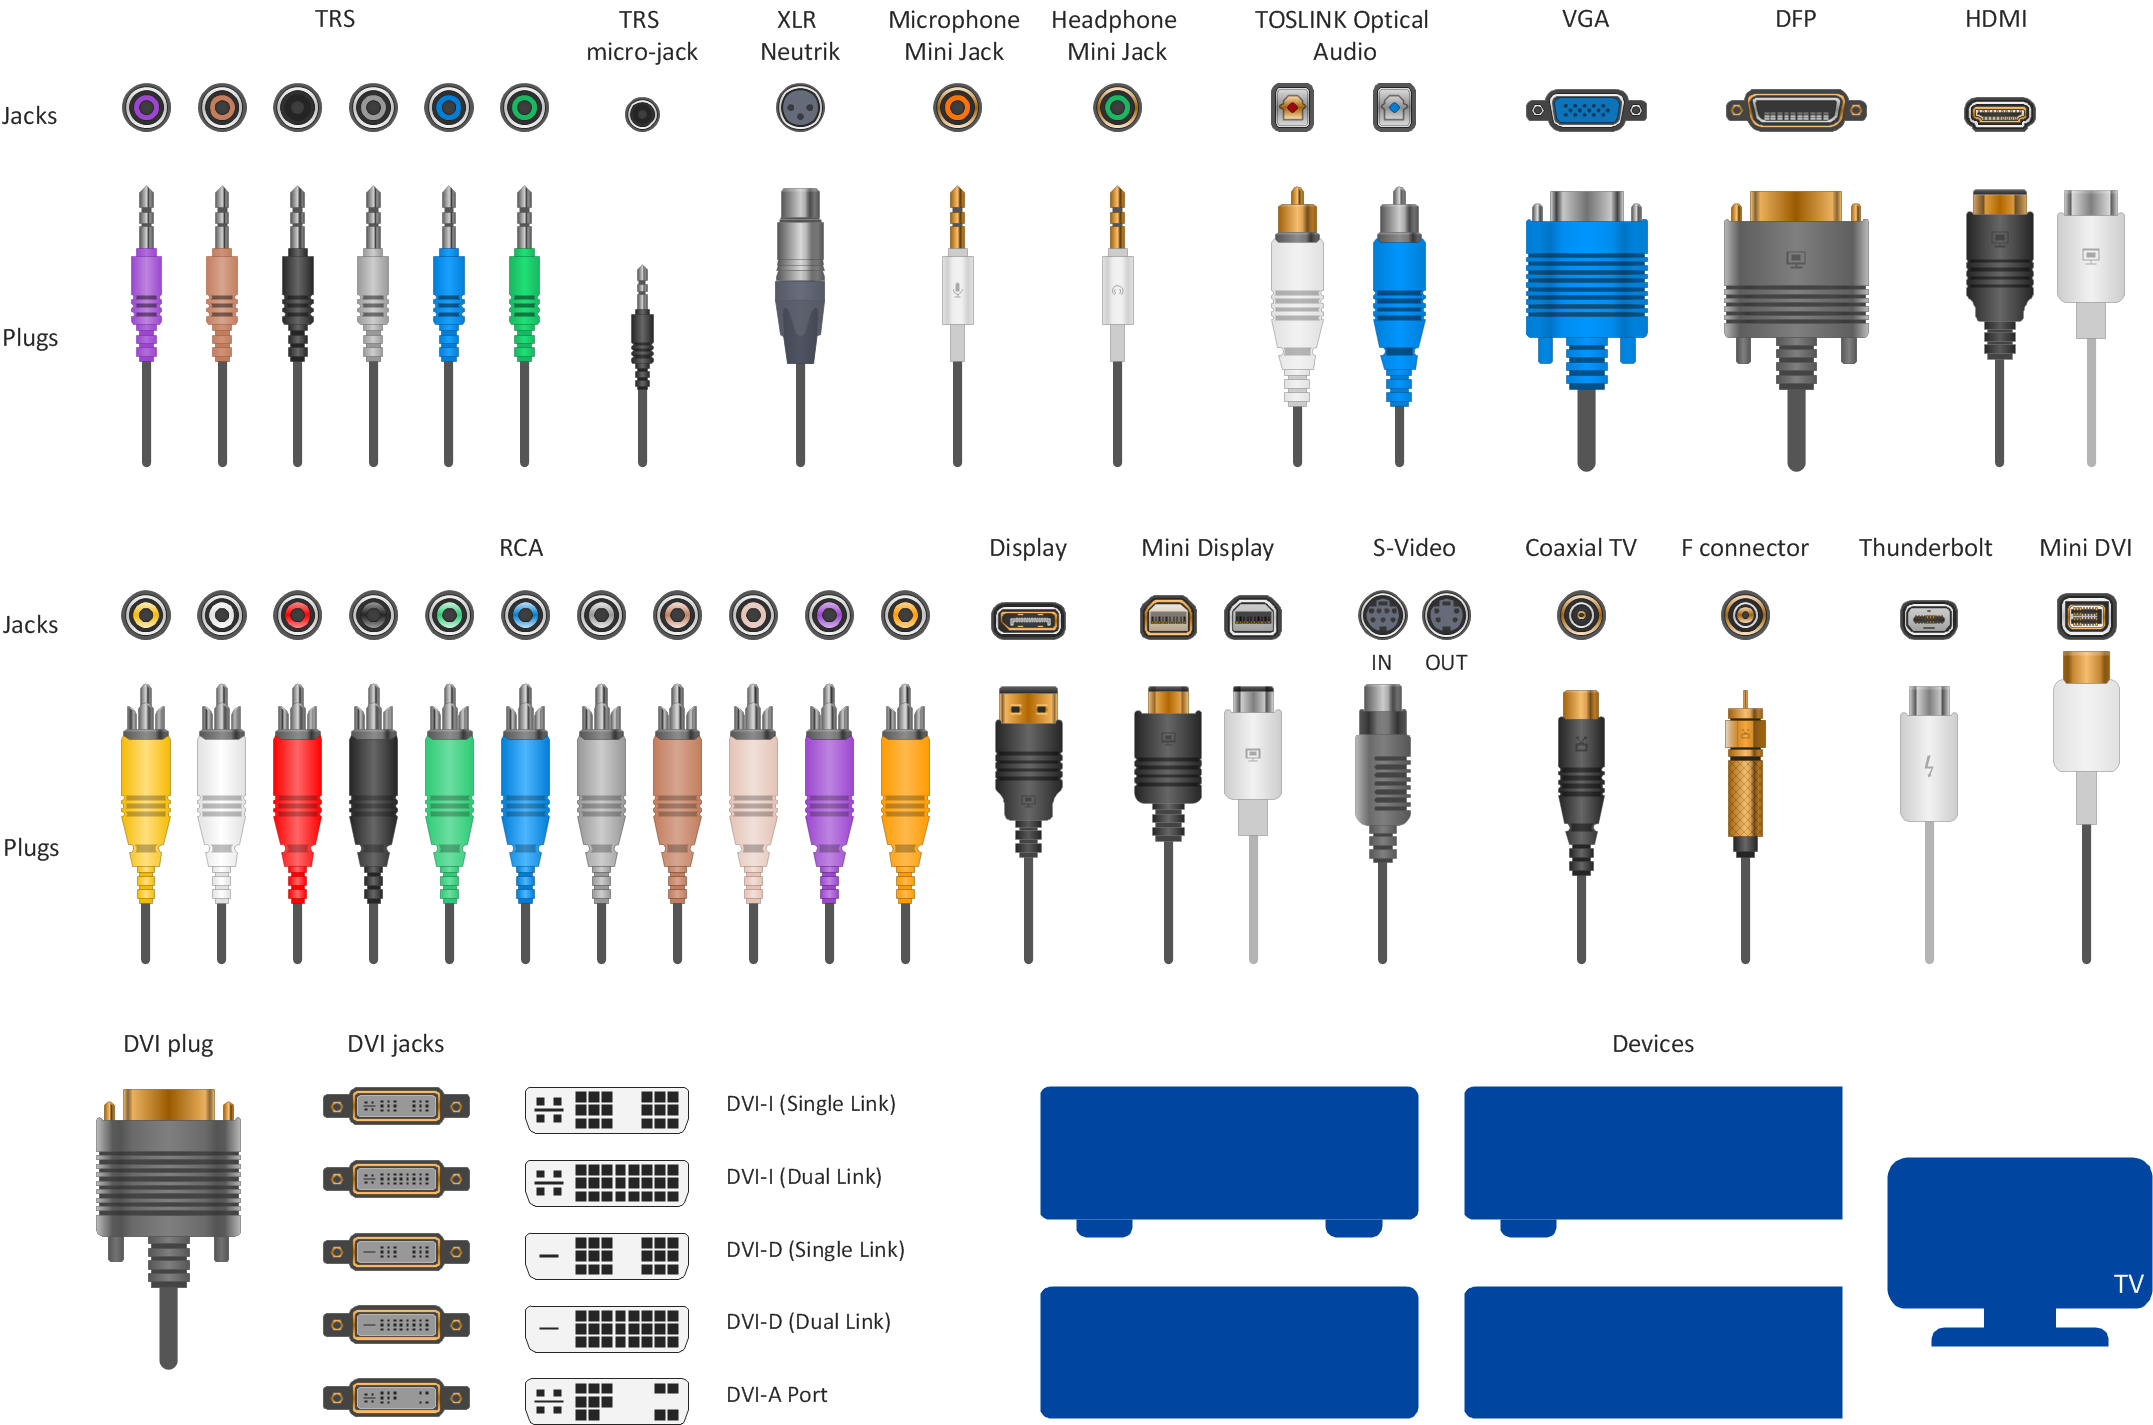
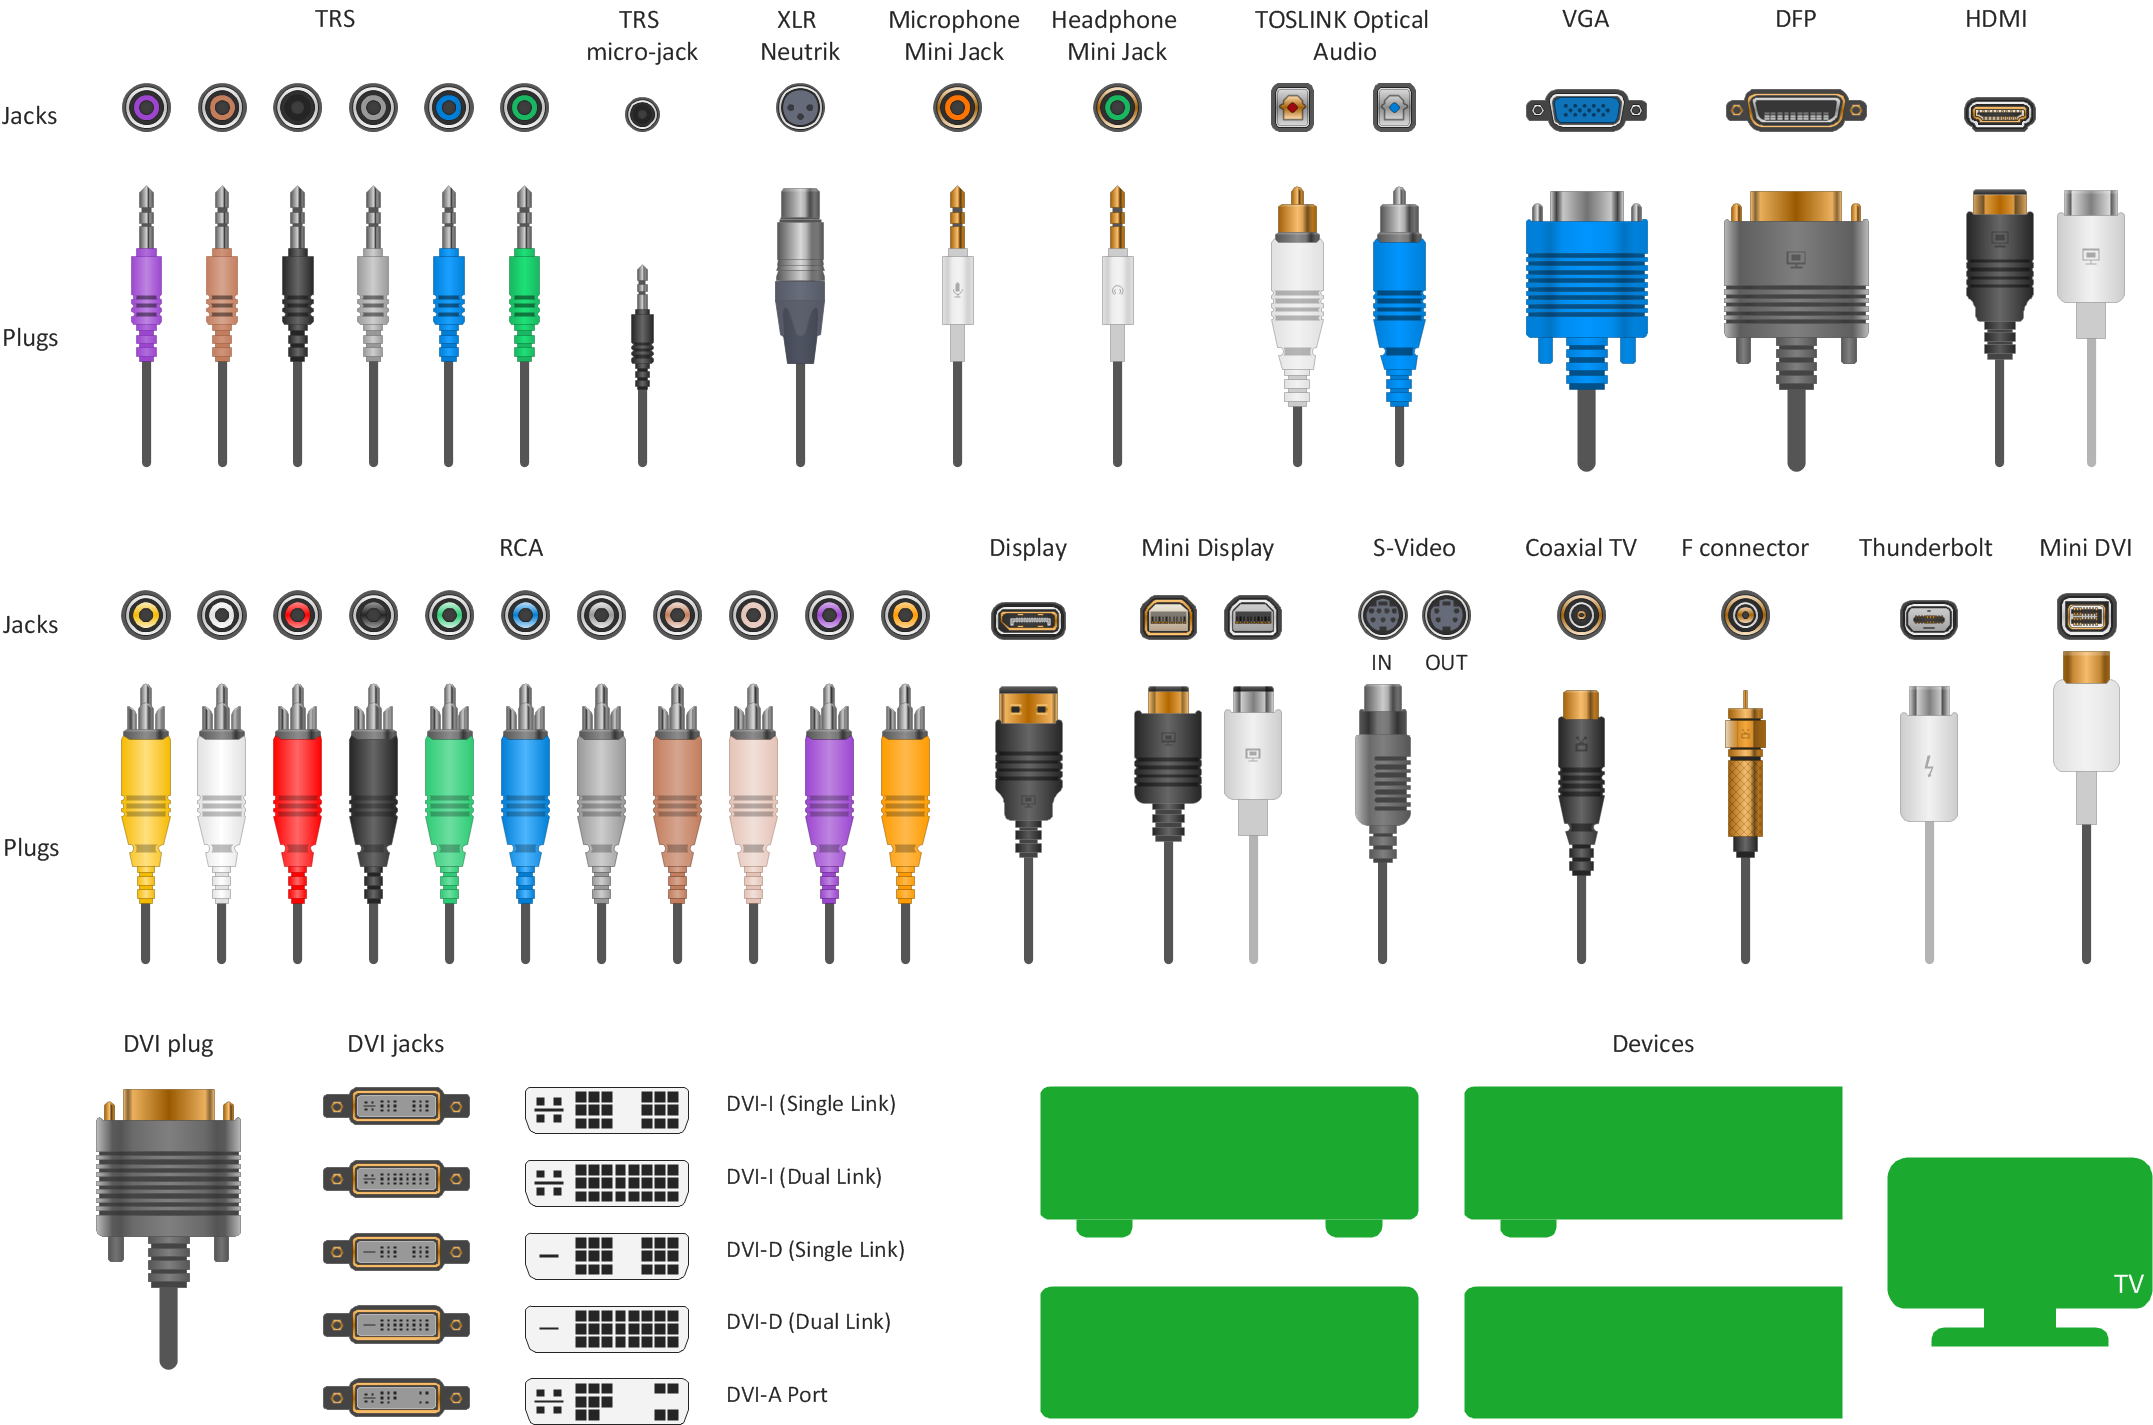
The Audio & Video Connectors solution contains a set of pre-designed objects, libraries, templates, and samples; allowing quick and easy diagramming of various configurations of audio and video devices.Standard Universal Audio & Video Connection Types
The Audio & Video Connectors solution contains a set of pre-designed objects, libraries, templates, and samples; allowing quick and easy diagramming of various configurations of audio and video devices.F&B
High competition among the restaurants at the food court requires original design ideas. To attract visitors and increase sales are used many kinds of advertising products, brightly colored signboards, menus and show-cases, often are used the molds of beautifully decorated dishes. Now designing of colorful F&B (food and beverage) materials is easier than ever thanks to the ConceptDraw PRO diagramming and vector drawing software extended with Food Court Solution from the Food and Beverage Area of ConceptDraw Solution Park.Food Art
Food courts are very popular places. You want to increase attendance, advertise and invite attention to your food court? Make interesting design and create pictorial and bright food art posters and signboards, and don't forget to decorate your menu with images of tasty treats!ConceptDraw PRO diagramming and vector software supplied with Food Court solution from the Food and Beverage area of ConceptDraw Solution Park offers powerful drawing tools for effective food art.
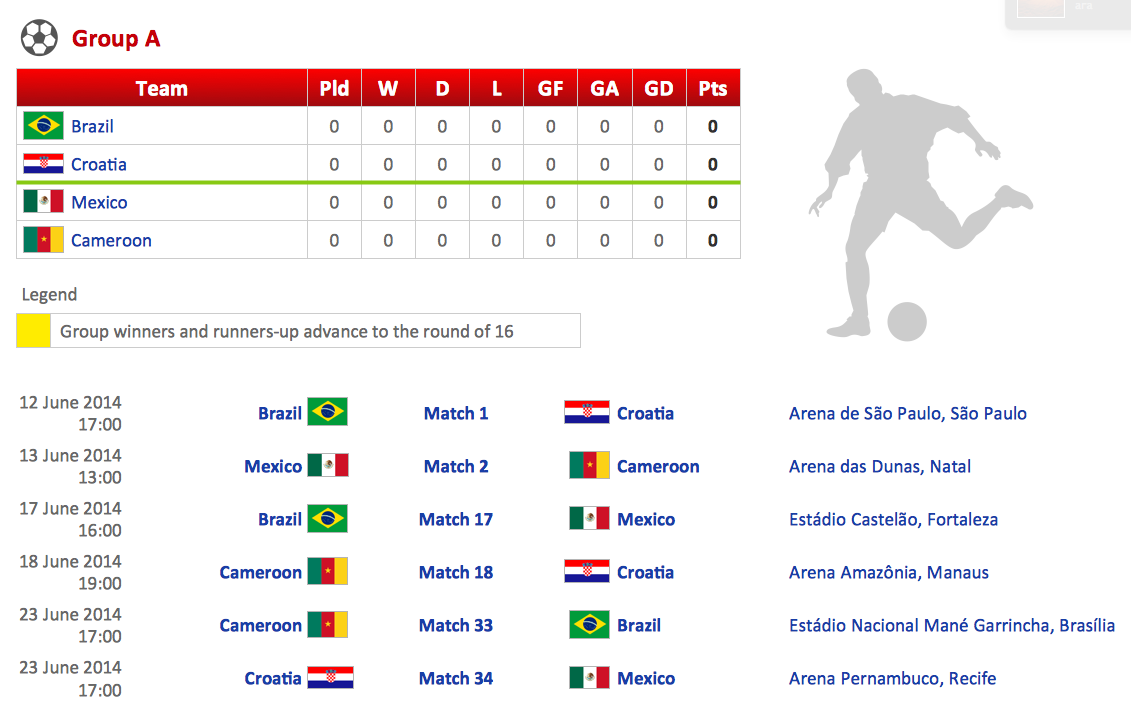
Football – 2014 FIFA World Cup Standings Group
You can see the samples representing the 2014 FIFA World Cup schedules and tournament tables for each of eight groups. These samples was created in ConceptDraw PRO using the “FIFA World Cup 2014 team flags”, “Soccer pictograms” and “Soccer silhouettes” libraries from the Soccer solution from the Sport area of ConceptDraw Solution Park.- Flowchart F
- Data F
- Process Flowchart | Fishbone Diagram | Software and Database ...
- Create Flow Chart on Mac | Process Flow app for Mac | Flowchart ...
- Library Managment System DFD Free Download
- How To Create Restaurant Floor Plan in Minutes | Process ...
- Basic Flowchart Symbols and Meaning | Integration Definition ...
- How To Create Presentation for Trainings and Learning process ...
- Chemical and Process Engineering | Design elements - Chemical ...
- Earthquake disaster assessment - Workflow diagram | Weather ...
- Design elements - Stars and planets | Aerospace - Design Elements ...
- Basic Flowchart Symbols and Meaning | How to Create an Event ...
- Football – 2014 FIFA World Cup Standings Group
- Process Flowchart | Network Diagram Software LAN Network ...
- Food security assessment - Flowchart | Weather - Vector stencils ...
- Weather - Vector stencils library | Thunder And Sun Png
- How To Share Presentation via Skype | Chemistry | Chemistry ...
- UML Use Case Diagram. Design Elements | Design elements ...
- Basic Flowchart Symbols and Meaning | Design elements ...
