"Planning (also called forethought) is the process of thinking about and organizing the activities required to achieve a desired goal.
Planning involves the creation and maintenance of a plan. As such, planning is a fundamental property of intelligent behavior. This thought process is essential to the creation and refinement of a plan, or integration of it with other plans; that is, it combines forecasting of developments with the preparation of scenarios of how to react to them.
An important, albeit often ignored aspect of planning, is the relationship it holds with forecasting. Forecasting can be described as predicting what the future will look like, whereas planning predicts what the future should look like. The counterpart to planning is spontaneous order." [Planning. Wikipedia]
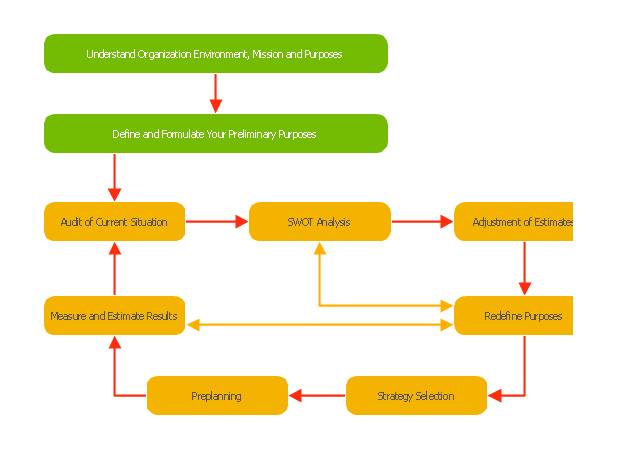
The block diagram example "Planning process" was created using the ConceptDraw PRO diagramming and vector drawing software extended with the Block Diagrams solution from the area "What is a Diagram" of ConceptDraw Solution Park.
Planning involves the creation and maintenance of a plan. As such, planning is a fundamental property of intelligent behavior. This thought process is essential to the creation and refinement of a plan, or integration of it with other plans; that is, it combines forecasting of developments with the preparation of scenarios of how to react to them.
An important, albeit often ignored aspect of planning, is the relationship it holds with forecasting. Forecasting can be described as predicting what the future will look like, whereas planning predicts what the future should look like. The counterpart to planning is spontaneous order." [Planning. Wikipedia]
The block diagram example "Planning process" was created using the ConceptDraw PRO diagramming and vector drawing software extended with the Block Diagrams solution from the area "What is a Diagram" of ConceptDraw Solution Park.
Block diagram
Create Block Diagram

The Building Blocks Used in EPC Diagrams

Business Diagram Software


Basic Diagramming


Best Vector Drawing Application for Mac OS X

IDEF3 Standard

IDEF0 standard with ConceptDraw DIAGRAM

 Basic Diagramming
This solution extends ConceptDraw DIAGRAM software with the specific tools you need to easily draw flowcharts, block diagrams, histograms, pie charts, divided bar diagrams, line graphs, circular arrows diagrams, Venn diagrams, bubble diagrams and concept maps
The Best Drawing Program for Mac

ConceptDraw Arrows10 Technology


 Engineering
This solution extends ConceptDraw DIAGRAM.4 with the ability to visualize industrial systems in electronics, electrical, chemical, process, and mechanical engineering.
Visual Presentations Made Easy with Diagramming Software

Workflow Diagram

ConceptDraw Arrows10 Technology

Total Quality Management with ConceptDraw

Applications

- Block diagram - Personal planning process | Seven Management ...
- Block diagram - Personal planning process | Create Block Diagram ...
- Decision Making | Block diagram - Customer decision making | Work ...
- Basic Diagramming | Create Block Diagram | Block Diagrams |
- Basic Diagramming
- Work Flow Diagrams with ConceptDraw PRO | IDEF3 Standard ...
- Seven Management and Planning Tools | Affinity diagram - Personal ...
- Process decision program chart (PDPC) - Personal activity | SWOT ...
- Garrett IA Diagrams with ConceptDraw PRO
- Types of Flowchart - Overview | Selecting & Creating Flowcharts ...
- Seven Management and Planning Tools | PROBLEM ANALYSIS ...
- Seven Management and Planning Tools | TQM Diagram Example ...
- Total Quality Management with ConceptDraw | Engineering ...
- Block diagram - Automotive HVAC system | Create Block Diagram ...
- Seven Management and Planning Tools | Fishbone Diagram ...
- Seven Management and Planning Tools | Decision Making | The ...
- Event-driven Process Chain Diagrams EPC | Universal ...
- Total Quality Management <nobr>(TQM)</nobr> Diagrams | Total ...
- Seven Management and Planning Tools | Business Productivity ...
- Seven Management and Planning Tools | Business Productivity ...