Helpful in all stages of quality management
Pyramid Diagram

Organizational Structure Total Quality Management

Seven Basic Tools of Quality - Flow Chart
 Total Quality Management TQM Diagrams
Total Quality Management Diagrams solution extends ConceptDraw DIAGRAM software with samples, templates and vector stencils library for drawing the TQM flowcharts.
Total Quality Management

Pyramid Diagram

 Quality Mind Map
This solution extends ConceptDraw MINDMAP software with Quality Management Mind Maps (Presentations, Meeting Agendas, Problem to be solved).
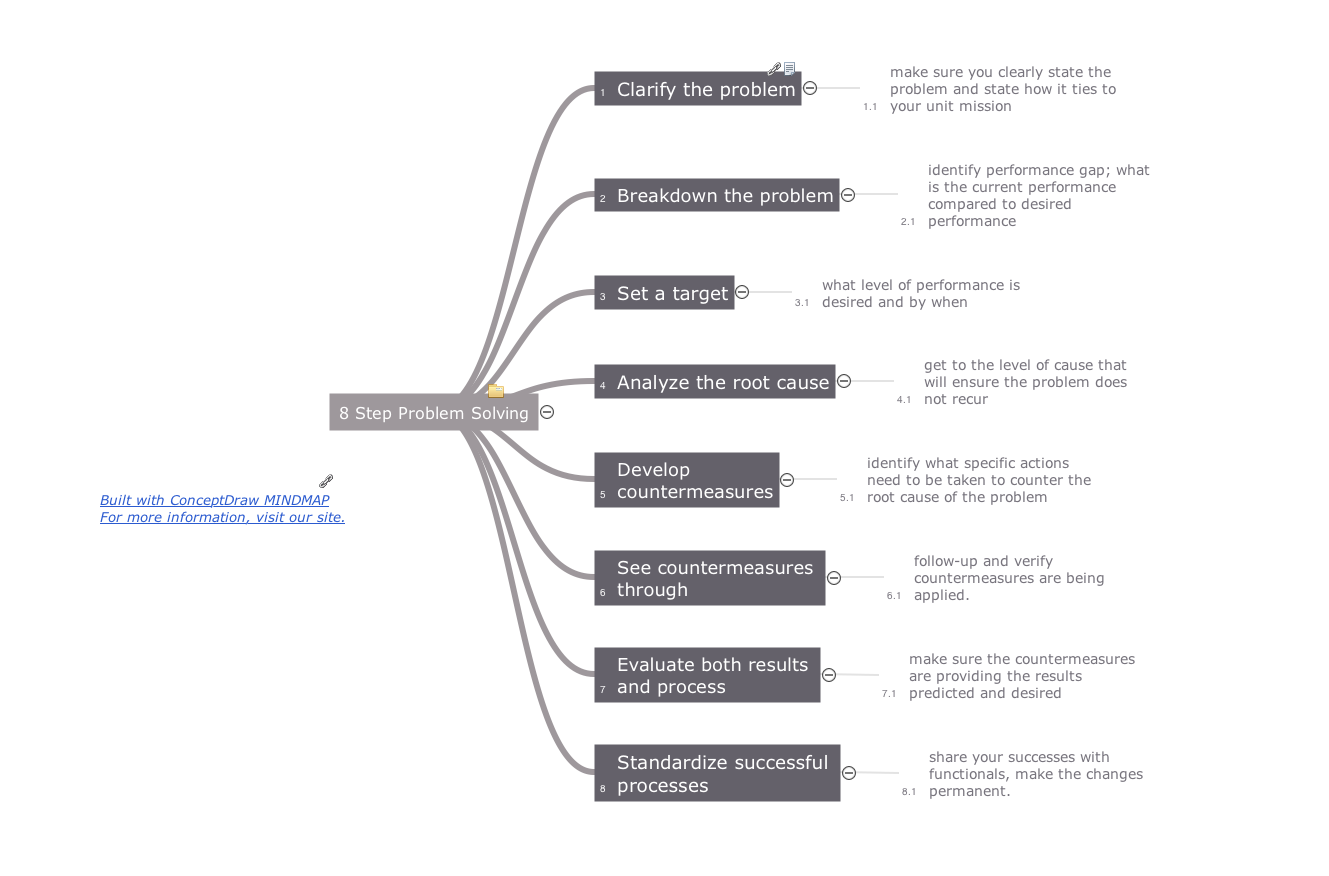
8 Step Problem Solving

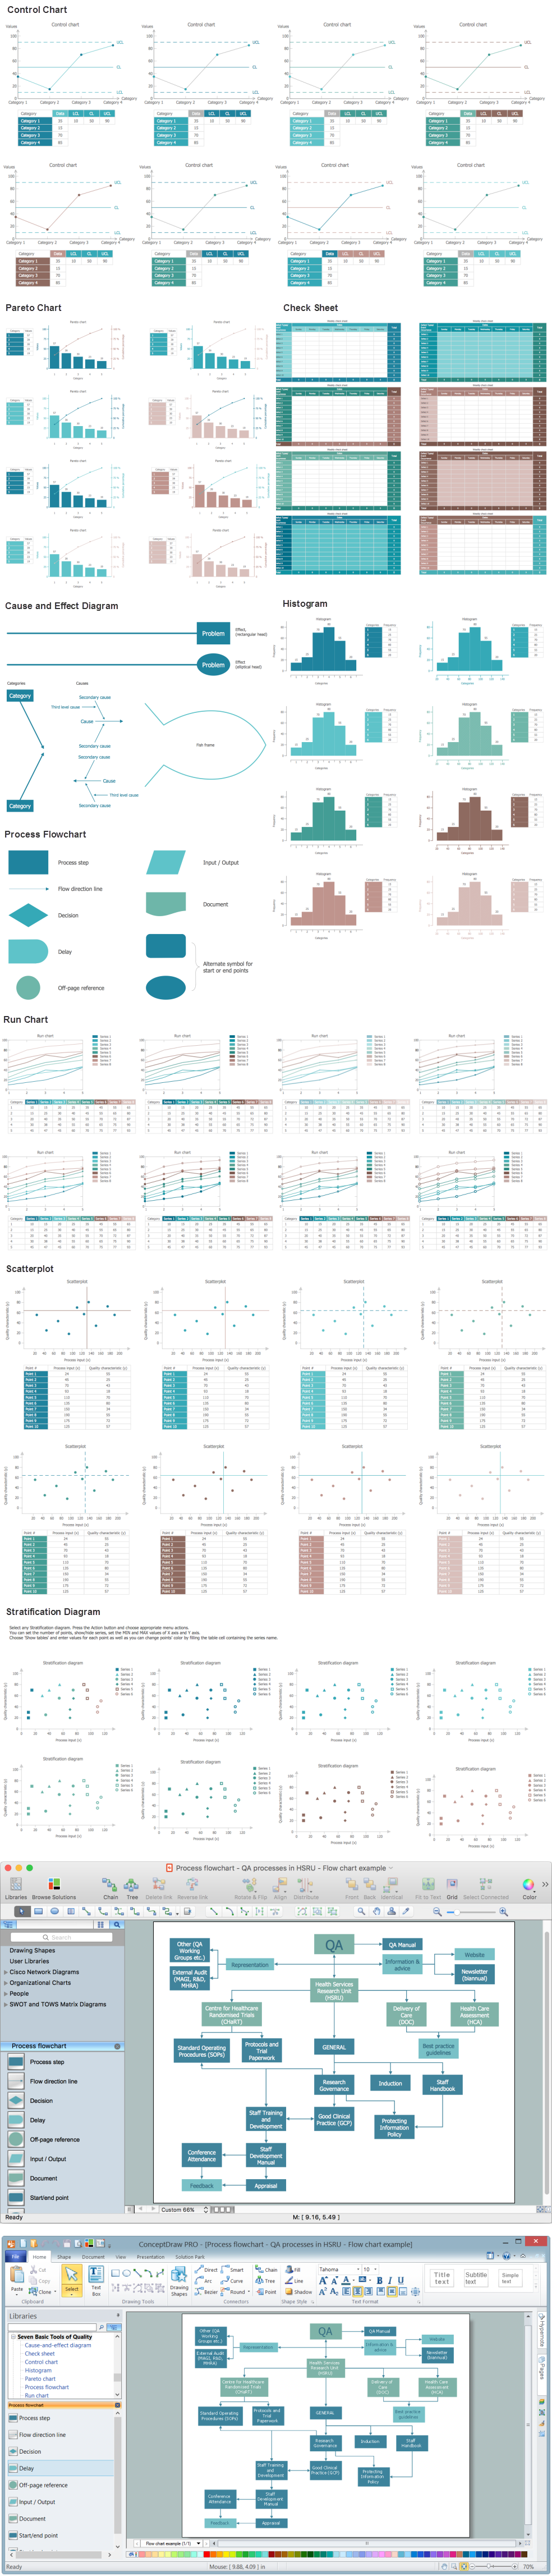
 Seven Basic Tools of Quality
Manage quality control in the workplace, using fishbone diagrams, flowcharts, Pareto charts and histograms, provided by the Seven Basic Tools of Quality solution.
Pyramid Diagram

How To Create Project Report

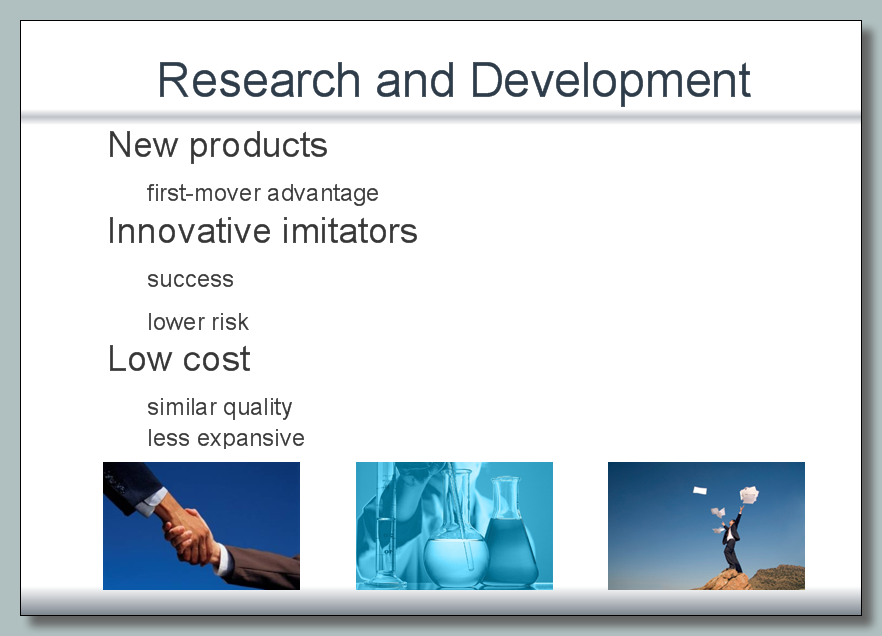
Steel Presentation
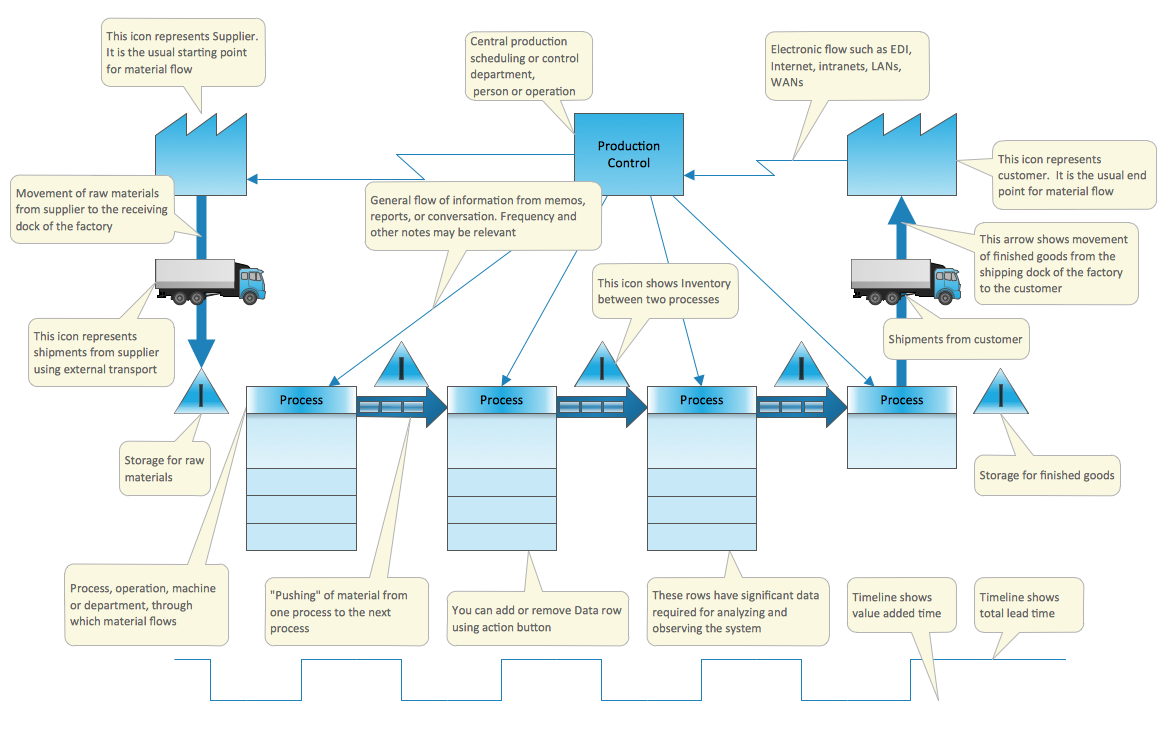
Value Stream Mapping Template
Pyramid Diagram

- Total Quality Management TQM Diagrams | Pyramid Diagram | TQM ...
- Pyramid Diagram | Total Quality Management Value | TQM Diagram ...
- Identifying Quality Management System | Pyramid Diagram | Block ...
- Organizational Structure Total Quality Management | Total Quality ...
- Quality In Manufacturing Pdf And Ppt
- Quality Management System Pyramid
- Organizational Structure Total Quality Management | Organizational ...
- Organizational Structure Total Quality Management | Pyramid ...
- Identifying Quality Management System | Definition TQM Diagram ...
- Total Quality Management Value | Pyramid Diagram | How To ...
- TQM Diagram — Professional Total Quality Management | Quality ...
- Pyramid Diagram | Work Flow Diagram | Total Quality Management ...
- Scatter Diagrams | Pyramid Diagram | Total Quality Management ...
- Pyramid Diagrams | Total Quality Management TQM Diagrams ...
- Pyramid Diagram | Time, quality , money triangle diagram | Quality ...
- Total Quality Management Value | Pyramid Diagram | Data Flow ...
- Seven Basic Tools of Quality - Flow Chart | Prioritization Matrix ...
- Identifying Quality Management System | Pyramid Diagram ...
- Total Quality Management TQM Diagrams | Definition TQM Diagram ...