 Fishbone Diagram
Fishbone Diagrams solution extends ConceptDraw PRO software with templates, samples and library of vector stencils for drawing the Ishikawa diagrams for cause and effect analysis.
Fishbone Diagram Example
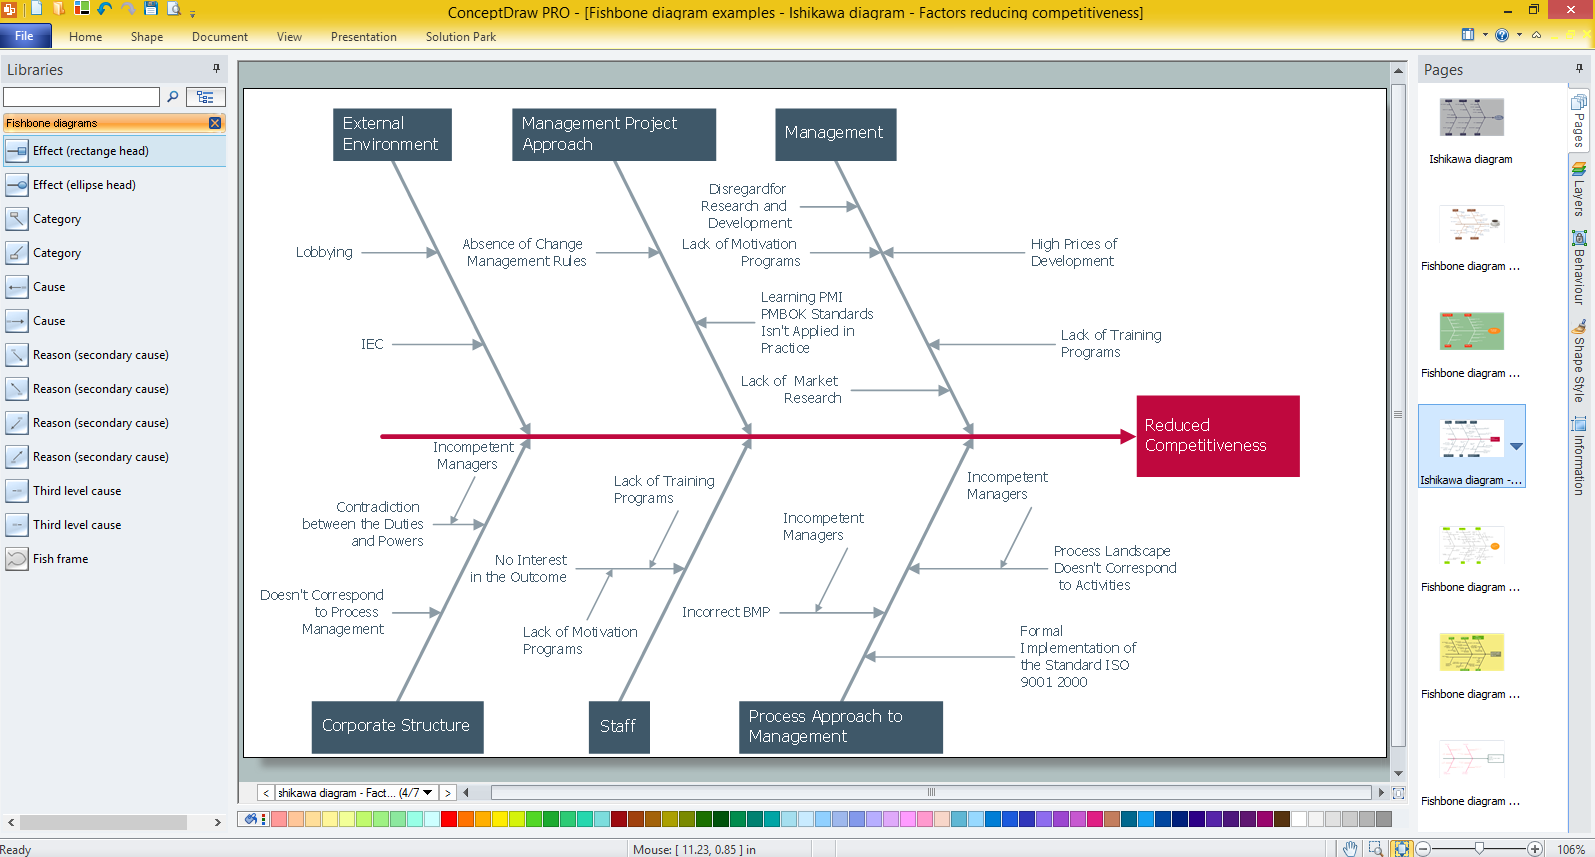
Fishbone Diagram, also referred as Cause and Effect diagram or Ishikawa diagram, is a fault finding and problem solving tool. Construction of Ishikawa diagrams is quite complicated process and has a number of features.Fishbone Diagrams solution included to ConceptDraw Solution Park contains powerful drawing tools and a lot of examples, samples and templates. Each Fishbone diagram example is carefully thought-out by experts and is perfect source of inspiration for you.
Total Quality Management Business Diagram
The Total Quality Management Diagram solution helps you and your organization visualize business and industrial processes. Create Total Quality Management diagrams for business process with ConceptDraw software.Cause and Effect Analysis
When you have some problems you need first to explore the reasons which caused them. Cause and Effect Analysis is a perfect way to do this. ConceptDraw PRO software enhanced with Fishbone Diagrams solution from the Management area of ConceptDraw Solution Park gives the ability to draw fast and easy Fishbone diagram that identifies many possible causes for an effect.Create Fishbone Diagrams with the ConceptDraw
ConceptDraw PRO has the powerful tools for rapid drawing Fishbone diagrams and identifying many possible causes for an effect for problem solving. Causes can be grouped into major categories to identify these sources of variation. Easy create Fishbone diagrams with the ConceptDraw PRO software and Fishbone Diagrams solution included to ConceptDraw Solution Park!Improving Problem Solving and Focus with Fishbone Diagrams
When you need to focus on the problem, professional diagramming tool helps you create a Fishbone diagram also known as Ishikawa diagram. Understanding of the problem via Fishbone diagram will improve the processes between departments and teams.ConceptDraw PRO extended with Fishbone Diagrams solution gives a powerful tool for improving problem solving and focus with Fishbone diagrams.
 Total Quality Management TQM Diagrams
Total Quality Management Diagrams solution extends ConceptDraw PRO software with samples, templates and vector stencils library for drawing the TQM flowcharts.
Cause and Effect Analysis - Fishbone Diagrams for Problem Solving
Fishbone diagram is a powerful tool used for solving business problems and obstacles. ConceptDraw PRO software extended with Fishbone Diagrams solution from the Management area of ConceptDraw Solution Park is a helpful tool for cause and effect analysis. It gives the ability to easy identify many possible causes and factors which cause the effects and to draw Fishbone Diagrams for problem solving.
 Quality Mind Map
This solution extends ConceptDraw MINDMAP software with Quality Management Mind Maps (Presentations, Meeting Agendas, Problem to be solved).
TQM Diagram Tool
The Total Quality Management Diagram solution helps you and your organization visualize business and industrial processes. Create Total Quality Management diagrams for business process with ConceptDraw software.
 Value Stream Mapping
Value stream mapping solution extends ConceptDraw PRO software with templates, samples and vector stencils for drawing the Value Stream Maps (VSM) in lean manufacturing practice.
 Matrices
This solution extends ConceptDraw PRO software with samples, templates and library of design elements for drawing the business matrix diagrams.
 Seven Management and Planning Tools
Seven Management and Planning Tools solution extends ConceptDraw PRO and ConceptDraw MINDMAP with features, templates, samples and libraries of vector stencils for drawing management mind maps and diagrams.
 Event-driven Process Chain Diagrams
Event-driven Process Chain (EPC) Diagram is a type of flowchart widely used for modeling in business engineering and reengineering, business process improvement, and analysis. EPC method was developed within the Architecture of Integrated Information Systems (ARIS) framework.
 Entity-Relationship Diagram (ERD)
Entity-Relationship Diagram (ERD) solution extends ConceptDraw PRO software with templates, samples and libraries of vector stencils from drawing the ER-diagrams by Chen's and crow’s foot notations.
- Business Productivity Diagramming | Fishbone Diagram | Cause ...
- Fishbone Diagram | Business Productivity Diagramming | Business ...
- Business Productivity Diagramming | Total Quality Management with ...
- Fishbone Diagram | Business Productivity Diagramming | Business ...
- Event-driven Process Chain Diagrams EPC | Fishbone Diagram ...
- Fishbone Diagram | Business Productivity Diagramming | Business ...
- Fishbone Diagram | Business Productivity Diagramming ...
- Ishikawa diagram - Factors reducing competitiveness | Business ...
- Fishbone Diagram | Business Productivity Diagramming | Cause ...
- Cause and Effect Analysis ( Fishbone Diagrams) - Conceptdraw.com
- Total Quality Management TQM Diagrams | Fishbone Diagram ...
- Fishbone Diagram | Quality fishbone diagram template | Fishbone ...
- Fishbone Diagram | Cause and Effect Analysis (Fishbone Diagrams ...
- Seven Management and Planning Tools | Fishbone Diagram | Total ...
- Business Productivity Diagramming | Fishbone Diagram | Business ...
- Fishbone Diagram | Business Productivity Diagramming | Entity ...
- Fishbone Diagram | Project Management Area | Business ...
- Business Productivity Diagramming | Ishikawa diagram - Factors ...
- Value Stream Mapping | Quality | Fishbone Diagram |
- Business Productivity Diagramming | Fishbone Diagram | Design ...


