Helpful in all stages of quality management
ConceptDraw Mind maps can be used to depict a quality process.Quality Management Teams
ConceptDraw MINDMAP with Quality mindmaps solution as a demonstration of the creative approach to quality management in daily work of quality management team.Mind Maps at work for Quality Managers
ConceptDraw MINDMAP preserves total quality management and helps bring out the best in your products and services.
 Quality Mind Map
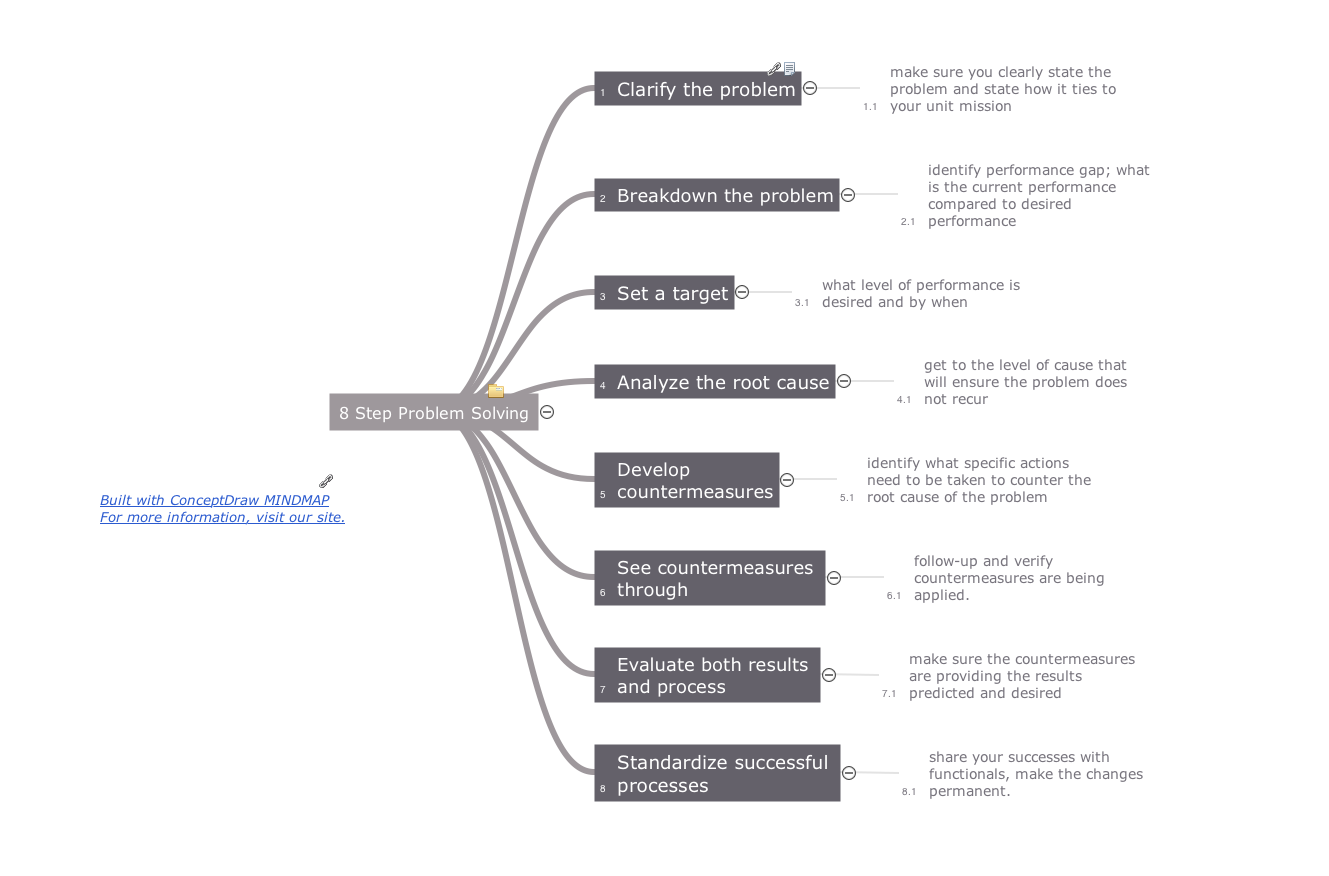
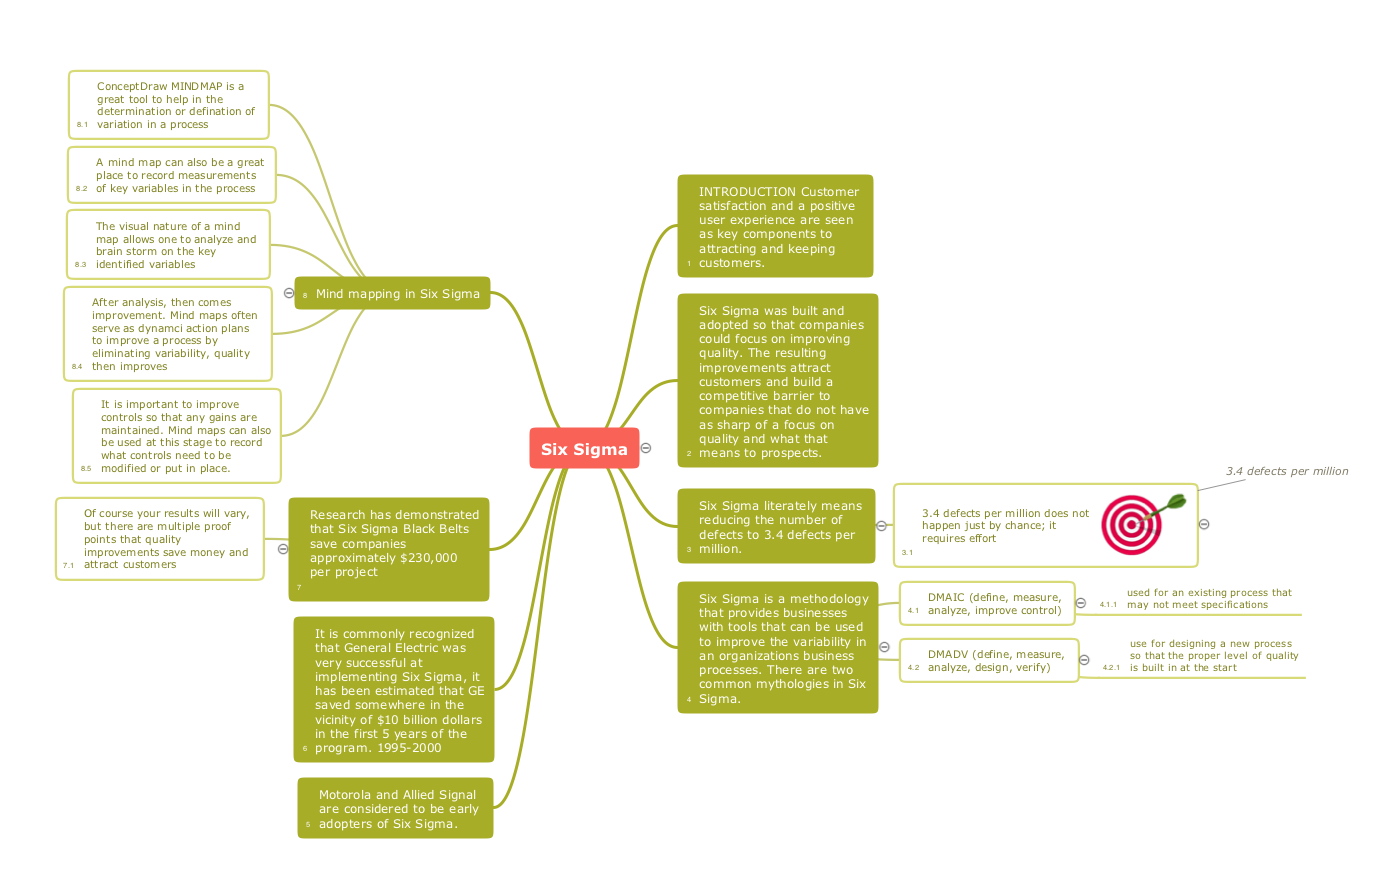
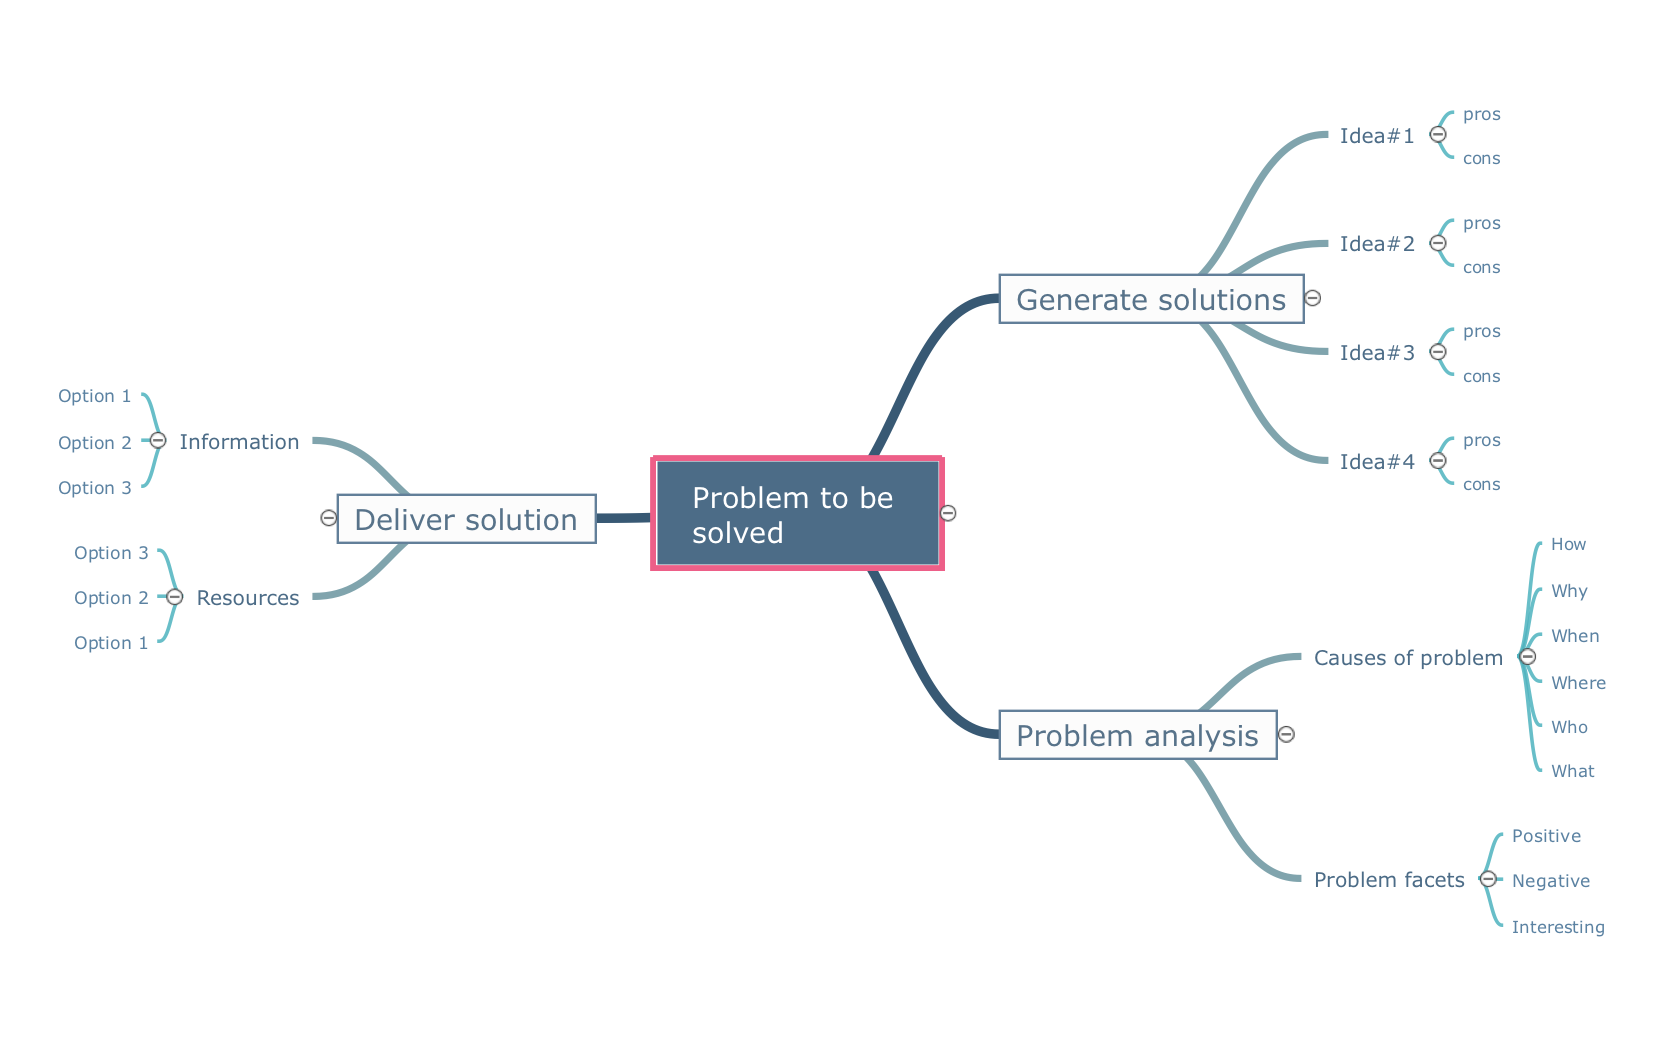
This solution extends ConceptDraw MINDMAP software with Quality Management Mind Maps (Presentations, Meeting Agendas, Problem to be solved).
Quality Improvement
Constant improvement of key performance indicators that are related to quality is a step in the right direction for a company interested in market growth.Constant improvement of key performance indicators
There are available tool to lend a fresh look to quality procedures - ConceptDraw MINDMAP.What is a Quality Management
Successful quality management implemented in a company of any size is a critical component of a company organization.Probability Quality Control Tools
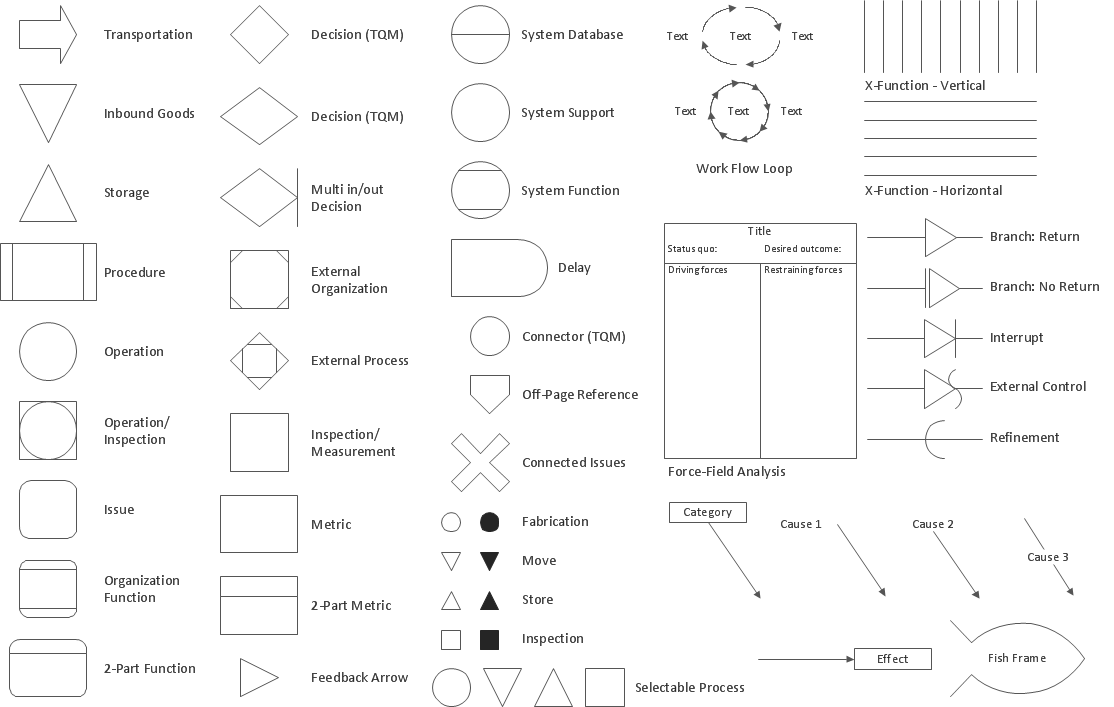
The Total Quality Management Diagram solution helps your organization visualize business and industrial processes. Create Total Quality Management diagrams for business process with ConceptDraw software.Total Quality Management Definition
The Total Quality Management Diagram solution helps you and your organization visualize business and industrial processes. Create Total Quality Management diagrams for business process with ConceptDraw software.The Fifty Two Elements of TQM
The Total Quality Management Diagram solution helps your organization visualize business and industrial processes. Create Total Quality Management diagrams for business process with ConceptDraw software.Organizational Structure Total Quality Management
The Total Quality Management Diagram solution helps you and your organization visualize business and industrial processes. Create Total Quality Management diagrams for business process with ConceptDraw software.TQM Diagram — Professional Total Quality Management
The Total Quality Management Diagram solution helps you and your organization visualize business and industrial processes. Create Total Quality Management diagrams for business process with ConceptDraw software.
 Seven Basic Tools of Quality
Manage quality control in the workplace, using fishbone diagrams, flowcharts, Pareto charts and histograms, provided by the Seven Basic Tools of Quality solution.
Definition TQM Diagram
The Total Quality Management Diagram solution helps your organization visualize business and industrial processes. Create Total Quality Management diagrams for business process with ConceptDraw software.TQM Diagram Example
The Total Quality Management Diagram solution helps you and your organization visualize business and industrial processes. Create Total Quality Management diagrams for business process with ConceptDraw software.Value Stream Diagram
The new Value Stream Mapping solution found in the ConceptDraw Solution Park continues to extend the range of ConceptDraw PRO into a business graphics tool.What is Value Stream Mapping?
Value stream maps (VSM) are an essential tool for organizations applying Lean methods.Quality Engineering Diagrams
Create Quality Engineering Diagrams (value stream maps) - for value stream analysis and value stream management, material and information flow mapping, using our quick start templates included with ConceptDraw.
 Event-driven Process Chain Diagrams
Event-driven Process Chain (EPC) Diagram is a type of flowchart widely used for modeling in business engineering and reengineering, business process improvement, and analysis. EPC method was developed within the Architecture of Integrated Information Systems (ARIS) framework.
Process Flowchart
The main reason of using Process Flowchart or PFD is to show relations between major parts of the system. Process Flowcharts are used in process engineering and chemical industry where there is a requirement of depicting relationships between major components only and not include minor parts. Process Flowcharts for single unit or multiple units differ in their structure and implementation. ConceptDraw PRO is Professional business process mapping software for making Process flowcharts, Process flow diagram, Workflow diagram, flowcharts and technical illustrations for business documents and also comprehensive visio for mac application. Easier define and document basic work and data flows, financial, production and quality management processes to increase efficiency of your business with ConcepDraw PRO. Business process mapping software with Flowchart Maker ConceptDraw PRO includes extensive drawing tools, rich examples and templates, process flowchart symbols and shape libraries, smart connectors that allow you create the flowcharts of complex processes, process flow diagrams, procedures and information exchange. Process Flowchart Solution is project management workflow tools which is part ConceptDraw Project marketing project management software. Drawing charts, diagrams, and network layouts has long been the monopoly of Microsoft Visio, making Mac users to struggle when needing such visio alternative like visio for mac, it requires only to view features, make a minor edit to, or print a diagram or chart. Thankfully to MS Visio alternative like ConceptDraw PRO software, this is cross-platform charting and business process management tool, now visio alternative for making sort of visio diagram is not a problem anymore however many people still name it business process visio tools.
- Helpful in all stages of quality management | Quality Management ...
- Total Quality Management Value | Quality Mind Map | Total Quality ...
- Quality Mind Map
- Quality Management Teams | Mind Mapping in the Quality ...
- Management | Mind Maps at work for Quality Managers | Quality ...
- Constant improvement of key performance indicators | Quality Mind ...
- Value Stream Mapping | Quality Mind Map | Process Flowchart ...
- Quality Mind Map | Mind Map Exchange | Quality Management ...
- Quality Mind Map | Quality Project Management with Mind Maps ...
- Successful Quality Management | Management | Quality Criteria ...
- Quality | Quality Mind Map | Quality Criteria MindMap | Quality ...
- Quality Mind Maps | Mind Maps for Business - SWOT Analysis | How ...
- Quality Mind Map | Total Quality Management Value | Successful ...
- Fundamental Tool in Quality Management | Quality Mind Maps ...
- Quality Mind Map | Presentations in Educational Process | A ...
- Quality Mind Maps
- How To Do A Mind Map In Powerpoint | One formula of professional ...
- Quality issues in heir organization | Quality Project Management ...
- Management | Business Productivity Area | Quality Mind Map | Mind ...
- Quality Mind Maps - samples and templates | Quality Improvement ...
