"Classic TQM Tools ...
Flow Charts Pictures, symbols or text coupled with lines, arrows on lines show direction of flow. Flowcharting enables
modeling of processes; problems/ opportunities and decision points etc. It develops a common understanding of a process by those in
volved." [whaqualitycenter.org/ Portals/ 0/ Tools%20 to%20 Use/ Classic%20 Quality%20 Tools/ Classic%20 TQM%20 Tools%20 R%20 2-12.pdf]
The vector stencils library TQM diagrams contains 58 symbols for drawing total quality management (TQM) flow charts using the ConceptDraw PRO diagramming and vector drawing software.
The example "Design elements - TQM diagram" is included in the Total Quality Management (TQM) Diagrams solution from the Quality area of ConceptDraw Solution Park.
 ConceptDraw Solution Park
ConceptDraw Solution Park collects graphic extensions, examples and learning materials
Network Diagram Software
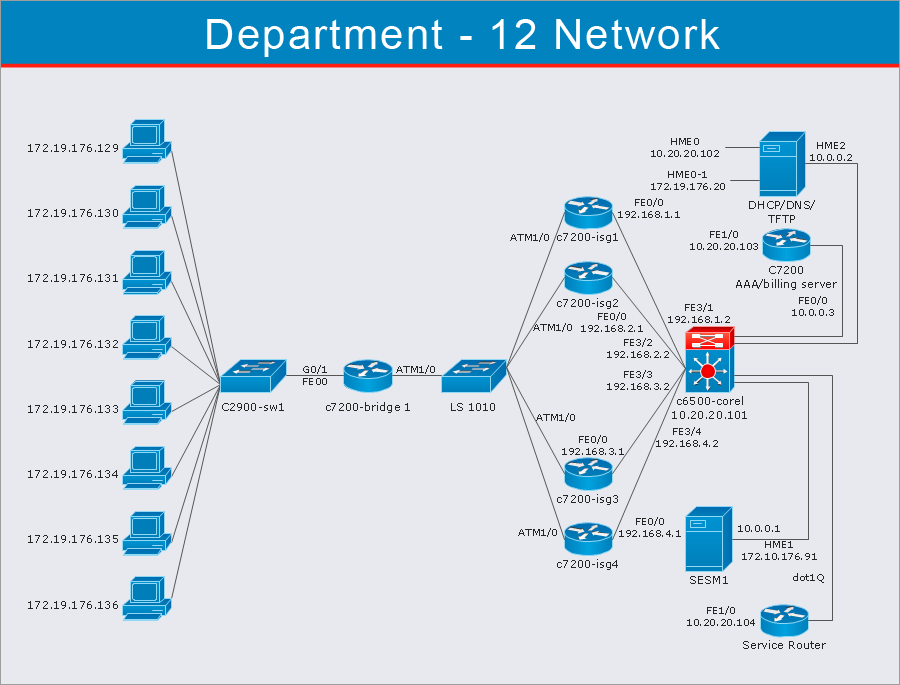
ConceptDraw Network Diagram Software - Network design software for network drawings with abundant examples and templates. Create computer network designs, diagrams and schematics using ConceptDraw.
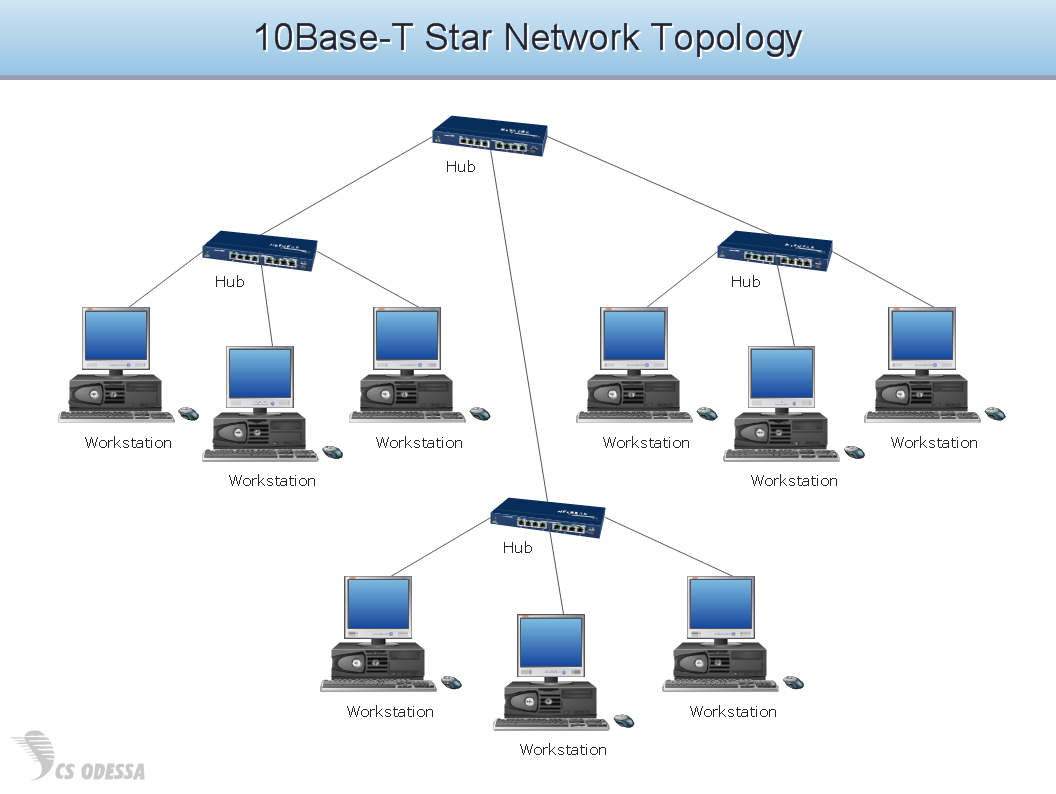
Network Diagram Software Topology Network
Draw Network Topology and Computer Network Diagrams, Designs, Schematics, and Network Maps using ConceptDraw in no Time!
HelpDesk
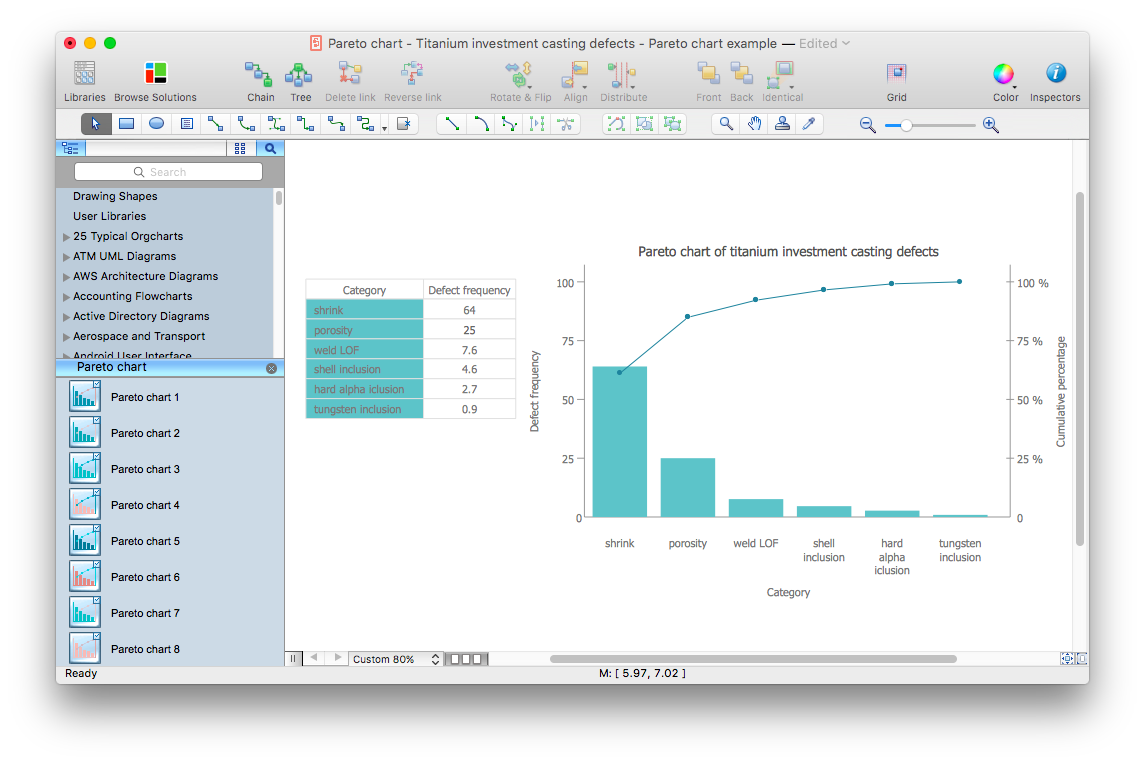
How to Draw a Pareto Chart Using ConceptDraw PRO
The Seven Basic Tools of Quality were picked as effective visual tool-set for identifying the root cause of quality-related problems within the workplace. Seven Basic Tools of Quality comprise of seven diagram that are diverse enough to be used to any business troubleshooting scenario, but simple enough that employees of all types can understand and apply them. One of these tools is a Pareto chart. It combines both a line graph and a bar chart, where the bar chart displays data values, and a line represents a total value. Pareto chart is used for quality control to identify the source of the quality problem. ConceptDraw Seven Basic Tools of Quality solution delivers a big set of vector stencil libraries and samples for each quality control diagram, including a Pareto chart.- Quality Drawing Symbol
- Quality Symbols In Mechanical Drawings
- Quality Control Drawing Symbols
- Mechanical Drawing Symbols | Mechanical Engineering | CAD ...
- Quality Diagram Symbols And Meanings Pdf
- Total Quality Management TQM Diagrams | TQM Diagram Example ...
- Quality Symbols And Meanings
- Mechanical Drawing Symbols | Mechanical Engineering | CAD ...
- Draw 20 Chart Symbols And Their Uses
- Draw 20 Flow Chart Symbols And Their Uses
- Flow Chart Symbols | Design elements - TQM diagram | Cross ...
- Quality Control Chart Software — ISO Flowcharting | Design ...
- Basic Flowchart Symbols and Meaning | Quality Control | Value ...
- Value Stream Mapping Symbols | Design elements - Value stream ...
- Mechanical Engineering | Mechanical Drawing Symbols ...
- Quality Control Chart Software — ISO Flowcharting | How to Draw a ...
- Symbols Used In Quality Control
- Flowchart design. Flowchart symbols , shapes, stencils and icons ...
- Process Flowchart | Quality Control Instruments Symbols
- Mechanical Engineering | ConceptDraw Solution Park | Total Quality ...


