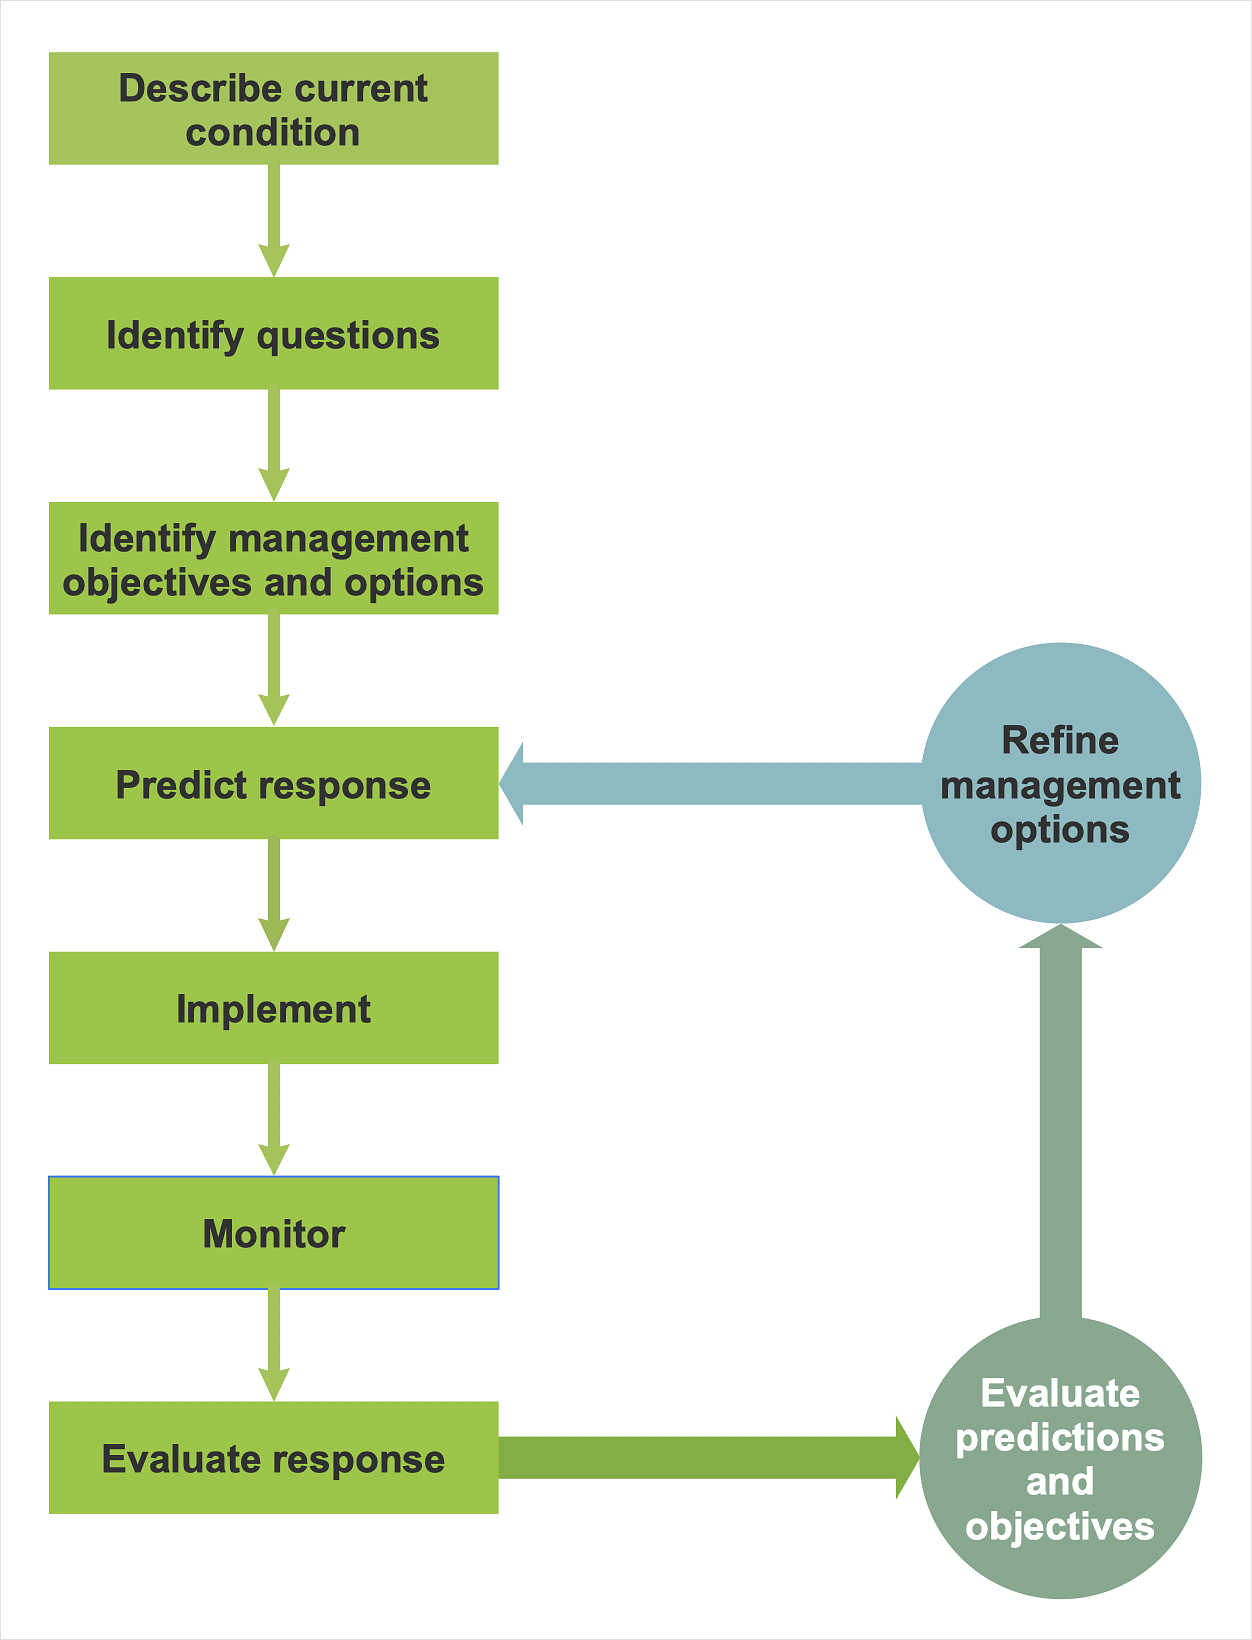
Organizational Structure Total Quality Management
The Total Quality Management Diagram solution helps you and your organization visualize business and industrial processes. Create Total Quality Management diagrams for business process with ConceptDraw software.Quality Control Chart Software — ISO Flowcharting
Quality Control Chart Software (ISO Flowcharting) - ConceptDraw DIAGRAM extended with Total Quality Management TQM Diagrams Solution from the Quality Management Area is the best diagramming and vector drawing software that allows you to draw the quality control charts quick and easy. The quality control chart is a graphic that illustrates the accordance of processes or products to the intended specifications and degree of differences from them. Depending on what type of data you need analyze, there are used different types of quality control charts: X-bar charts, S charts, Np charts.HelpDesk
How to Create a TQM Diagram Using Total Quality Management Diagrams Solution
TQM diagrams, created with ConceptDraw tools can be used for developing improvement plans and quality solutions in a business organization. Total quality management (TQM) tools are used to identify, analyze and assess data responsible for enhancing quality and productivity in business organizations.
 Total Quality Management TQM Diagrams
Total Quality Management Diagrams solution extends ConceptDraw DIAGRAM software with samples, templates and vector stencils library for drawing the TQM flowcharts.
TQM Diagram — Professional Total Quality Management
The Total Quality Management Diagram solution helps you and your organization visualize business and industrial processes. Create Total Quality Management diagrams for business process with ConceptDraw software.Total Quality Management Definition
The Total Quality Management Diagram solution helps you and your organization visualize business and industrial processes. Create Total Quality Management diagrams for business process with ConceptDraw software.TQM Diagram Example
The Total Quality Management Diagram solution helps you and your organization visualize business and industrial processes. Create Total Quality Management diagrams for business process with ConceptDraw software.Probability Quality Control Tools
The Total Quality Management Diagram solution helps your organization visualize business and industrial processes. Create Total Quality Management diagrams for business process with ConceptDraw software.TQM Diagram Tool
The Total Quality Management Diagram solution helps you and your organization visualize business and industrial processes. Create Total Quality Management diagrams for business process with ConceptDraw software.
 Organizational Charts
Organizational Charts solution extends ConceptDraw DIAGRAM software with samples, templates and library of vector stencils for drawing the org charts.
Create TQM Flowcharts for Mac
The Total Quality Management Diagram solution helps your organization visualize business and industrial processes. Create Total Quality Management diagrams for business process with ConceptDraw software.Total Quality Management with ConceptDraw
Total Quality Management (TQM) system is the management method where the confidence in quality of all organization processes is placed foremost. The given method is widely used in production, in educational system, in government organizations and so on.
 ConceptDraw Solution Park
ConceptDraw Solution Park collects graphic extensions, examples and learning materials
"The Process Flow Chart provides a visual representation of the steps in a process. ...
When to Use:
One of the first activities of a process improvement effort is constructing a flowchart. It provides the following benefits:
1- It give you and everyone a clear understanding of the process.
2- Facilitates teamwork and communication.
3- Helps to identify non-value-added operations."
[bexcellence.org/ Flow-Chart.html]
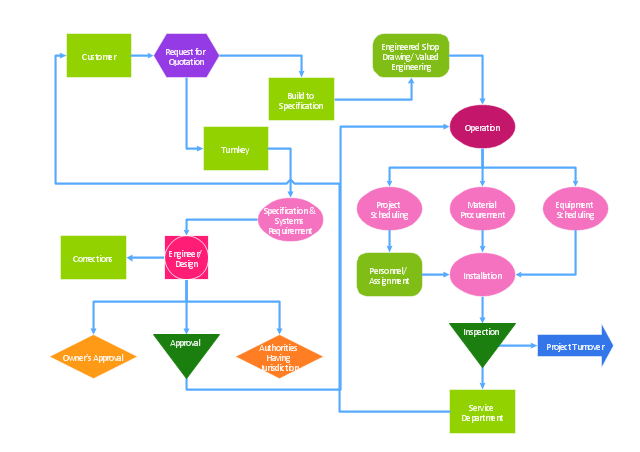
This TQM diagram example shows a business process that can be then analyzed to improve the effectiveness and diagnose quality issues that require resolution.
This example was created using the ConceptDraw PRO diagramming and vector drawing software extended with the Total Quality Management (TQM) Diagrams solution from the Quality area of ConceptDraw Solution Park.
"Classic TQM Tools ...
Flow Charts Pictures, symbols or text coupled with lines, arrows on lines show direction of flow. Flowcharting enables
modeling of processes; problems/ opportunities and decision points etc. It develops a common understanding of a process by those in
volved." [whaqualitycenter.org/ Portals/ 0/ Tools%20 to%20 Use/ Classic%20 Quality%20 Tools/ Classic%20 TQM%20 Tools%20 R%20 2-12.pdf]
The vector stencils library TQM diagrams contains 58 symbols for drawing total quality management (TQM) flow charts using the ConceptDraw PRO diagramming and vector drawing software.
The example "Design elements - TQM diagram" is included in the Total Quality Management (TQM) Diagrams solution from the Quality area of ConceptDraw Solution Park.
 25 Typical Orgcharts
The 25 Typical Orgcharts solution contains powerful organizational structure and organizational management drawing tools, a variety of professionally designed organization chart and matrix organization structure samples, 25 templates based on various orga
TQM Software — Build Professional TQM Diagrams
The Total Quality Management Diagram solution helps you and your organization visualize business and industrial processes. Create Total Quality Management diagrams for business process with ConceptDraw software.
 Seven Basic Tools of Quality
Manage quality control in the workplace, using fishbone diagrams, flowcharts, Pareto charts and histograms, provided by the Seven Basic Tools of Quality solution.
Business Processes
The most worked out and commonly used methodology of business processes description is IDEF methodology. Besides business processes it allows to describe functional blocks, for example production and marketing. ConceptDraw lets creation of business processes description using IDEF0 and IDEF2 methods.Applications
ConceptDraw DIAGRAM is a multipurpose software from ConceptDraw suite intended for diagramming, business and technical drawing, and visual documenting. You can reach a lot of practical benefits from the use of ConceptDraw DIAGRAM. The list of ConceptDraw DIAGRAM applications and versatile possibilities is extremely great. Among them network and system diagramming, business diagramming, Cisco network design, network visualization, software and database design, software development, business flowcharting, data flow design, databases modeling and visualization, business processes modeling, business drawing, technical drawing, GUI prototyping, Organizational charts construction, business processes fixing, web site planning and design, Internet solutions design, information architecture design, UML modeling, ER diagrams design, home and landscape design, and a lot of other applications. ConceptDraw DIAGRAM offers the users a beneficial collaboration, compatibility with MS Visio and many other popular programs, including other products from ConceptDraw suite.- Organizational Structure Total Quality Management
- TQM Diagram Example
- Organizational Structure Total Quality Management | Identifying ...
- How to Draw an Organization Chart | Organizational Structure Total ...
- Design elements - TQM diagram | Total Quality Management TQM ...
- Organization Chart Of Total Quality Management
- Design elements - TQM diagram | Total Quality Management TQM ...
- Total Quality Management Definition | Design elements - TQM ...
- Probability Quality Control Tools | TQM Diagram Tool | TQM Diagram
- Total Quality Management TQM Diagrams | TQM Diagram Example ...
- How to Draw an Organization Chart | Management | Identifying ...
- Organizational Structure Total Quality Management | Identifying ...
- How to Draw an Organization Chart | Organizational Structure Total ...
- Total Quality Management TQM Diagrams | TQM Diagram ...
- Organizational Chart Template | How to Draw an Organization Chart ...
- Organizational Structure Total Quality Management | Organizational ...
- Organizational Structure | Organizational Structure Total Quality ...
- TQM Diagram Example
- Total Quality Management TQM Diagrams | TQM diagram example ...
- Total Quality Management with ConceptDraw | Business Diagram ...


